Figures & data
Table 1. ADCs, targets, and tumor indications of eight vc-MMAE ADCs included in the analysis
Table 2. PK parameters (mean ± SD [%CV]) of acMMAE, total antibody and unconjugated MMAE post the first dose of vc-MMAE ADCs at 2.4 mg/kg (90 min IV infusion)
Figure 1. Chemical structure of a vc-MMAE ADC
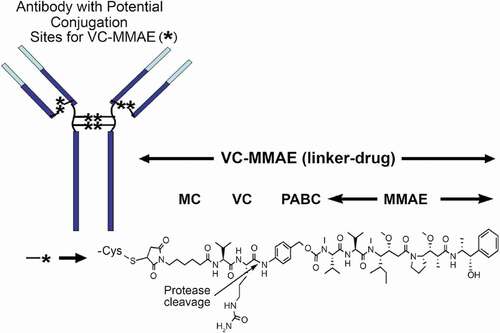
Figure 2. Concentration (in nM)–time profiles (mean + SD) of acMMAE, total antibody and unconjugated MMAE (uMMAE) post the first dose of vc-MMAE ADCs at 2.4 mg/kg (90 min intravenous infusion)
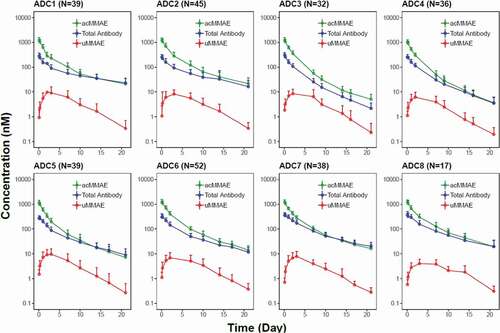
Figure 3. Exposure comparison of acMMAE, total antibody and unconjugated MMAE across the eight vc-MMAE ADCs post the first dose of vc-MMAE ADCs at 2.4 mg/kg (90 min intravenous infusion)
Figure 4. Dose-dependency of acMMAE and unconjugated MMAE PK for the eight vc-MMAE ADCs.
B. Dose-normalized AUCinf at Cycle 1 of unconjugated MMAE vs dose
Open cycle: observed data, AUCinf: area under the concentration–time curve from time zero to infinity, acMMAE: antibody-conjugated MMAE, ADC1 = Pinatuzumab vedotin (CD22); ADC2 = Polatuzumab vedotin (CD79b); ADC3 = DEDN6526A (ETBR); ADC4 = DMOT4309A (MsLN); ADC5 = DMUC5754A (MUC-16); ADC6 = DNIB0600A (Napi2b); ADC7 = DSTP3086S (Steap1); ADC8 = DFRF4539A (FcRH5)
Figure 5. Correlation of AUCinf at Cycle 1 between analytes post the first dose of vc-MMAE ADCs over the doses tested (90 min IV infusion).
B. acMMAE vs unconjugated MMAE
Open cycle: observed data, The black line and shaded gray area represent linear regression model prediction and 90% confidence interval of predictions, acMMAE: antibody-conjugated MMAE, AUCinf: area under the concentration–time curve from time zero to infinity, ADC1 = Pinatuzumab vedotin (CD22); ADC2 = Polatuzumab vedotin (CD79b); ADC3 = DEDN6526A (ETBR); ADC4 = DMOT4309A (MsLN); ADC5 = DMUC5754A (MUC-16); ADC6 = DNIB0600A (Napi2b); ADC7 = DSTP3086S (Steap1); ADC8 = DFRF4539A (FcRH5)
Figure 6. Logistic regression analysis of exposure-efficacy (ORR) response relationship by acMMAE AUCinf at Cycle 1
Figure 7. Logistic regression analysis of exposure-safety (Grade 2+ peripheral neuropathy) response relationship by acMMAE AUCinf at Cycle 1