Figures & data
Figure 1. Specific T cell and responding donor frequencies. T cell lines (T cells contained in a single well) were generated by 3 weekly rounds of stimulation with secukinumab, ixekizumab or KLH (positive control) and their specificity was tested by IFN-γ ELISpot. Frequencies of CD4 T cells specific for monoclonal antibodies or KLH (a) and donor response (B, %) for 31 healthy blood donors. A donor was considered a responder if at least one T cell line was detected. The frequency of CD4 T cell precursors was calculated using the Poisson’s distribution. Data was analyzed using Wilcoxon matched-pairs signed rank test, **p < .01. KLH, Keyhole limpet hemocyanin; IFN-γ, interferon gamma
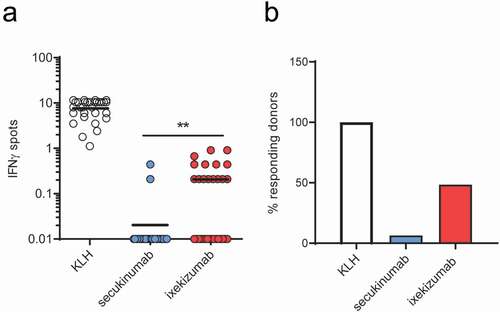
Figure 2. T cell lines responsive to secukinumab and ixekizumab Set 1 peptides. T cell lines (T cells contained in a single well) from 16 healthy blood donors were generated and tested for recognition of Set 1 secukinumab (a) and ixekizumab (b) peptides (SEC/IXE Pools 1.1–1.5). Their specificity was tested by IFN-γ ELISpot. T cell lines reacting to ixekizumab peptide pools in (B) were stimulated with individual peptides of the positive pools, and responding donors are demonstrated in (c). IFN-γ, interferon gamma; SEC, secukinumab; IXE, ixekizumab
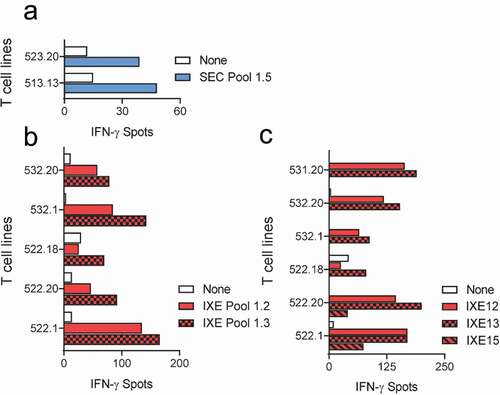
Figure 3. T cell lines responsive to secukinumab and ixekizumab set 2 peptides. T cell lines (T cells contained in a single well) from 15 healthy blood donors were generated and tested for recognition of Set 2 secukinumab (a) and ixekizumab (b) peptide pools 2.1–2.3. Their specificity was tested by IFN-γ ELISpot. T cell lines reacting to ixekizumab peptide pools in (B) were retested with individual peptides of the positive pools. (c-d) represents MAPPs peptides while peptides (e-f) cover the CDR regions. IFN-γ, interferon gamma; SEC, secukinumab; IXE, ixekizumab
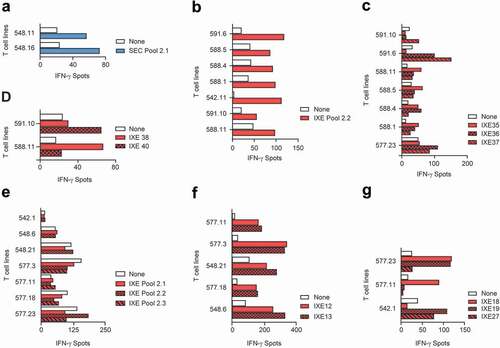
Figure 4. T cell responsiveness to individual MAPPs and CDR ixekizumab peptides. Number of T cell lines (a) and number of donors (b) responding to both Set 1 and Set 2 individual ixekizumab peptides. IXE, ixekizumab
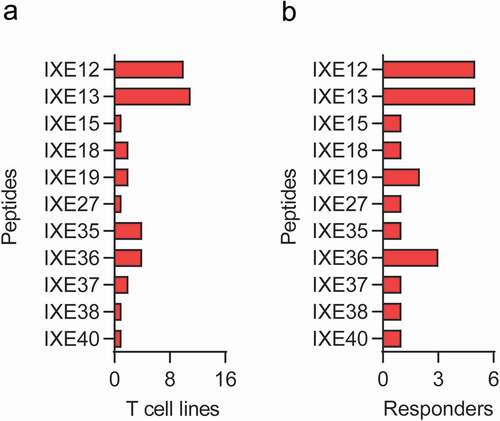
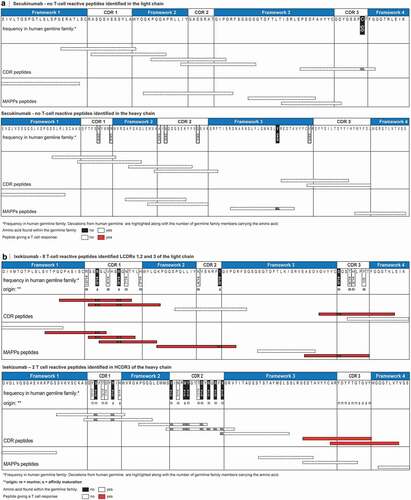
Figure 5. T cell epitopes identified in ixekizumab and secukinumab. Secukinumab (a) heavy and light chain were aligned to closest germline IGHV3-7*01|IGHJ2*01 and IGKV3-20*01|IGKJ5*01, respectively. Ixekizumab (b) heavy and light chain were aligned to closest germline IGHV1-69*01|IGHJ1*01 and IGKV2D-29*02|IGKJ2*01, respectively. For ixekizumab (B), deviations are labeled according to their origin.Citation23 Deviations in the amino acid sequence are highlighted along with the number of germline family members. CDR and MAPPs derived peptides are mapped graphically below the amino acid sequence and colored according to their reactivity in the T cell assay. The definition of framework and CDR is as previously described.Citation35 CDR, complementarity determining region; MAPPs, major histocompatibility complex–associated peptide proteomics