
Figures & data
Figure 1. Architecture of the alternative splicing (AS) construct. (a) The sequence coding for the protein of interest has a weak splice donor site (5’SD1) upstream of the stop codon. The intron following the stop codon has a strong splice donor site (5ʹ SD2), an optional polyadenylation signal (poly(A)), a branch point (depicted by A in the figure), a polypyrimidine (poly(y)) tract and a splice acceptor sequence (3ʹ SA). It is followed by an exon coding for a transmembrane domain (TM domain), which is composed of an extracellular linker sequence, a transmembrane helix (TM helix) and a cytosolic tail (Cyto. tail) and terminated by a stop codon. The expression cassette is closed by a polyadenylation signal (poly(A)). (b and c) The two mRNA species obtained after splicing. (d) Antibody cell surface display 1 day after transient transfection of CHO-S cells with AS construct for the expression of a mAb. As control, cells were transfected with a NoS expression vector coding for the same antibody. (e) Expression level of the transiently transfected cells on day four (n ≥ 3, mean ± standard deviation)
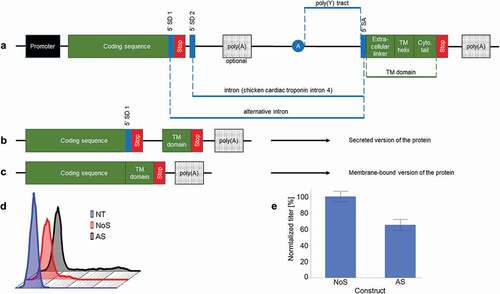
Figure 2. Modification of the transmembrane domain of AS construct. (a) Impact of the transmembrane domain on secretion level (n ≥ 3, mean ± standard deviation). (b) Impact of the different transmembrane on the surface staining. (c) Impact of transmembrane helix length on secretion level (n ≥ 3, mean ± standard deviation, *: p < .001 in Tukey–Kramer test). (d) Impact of transmembrane helix length on surface staining. In blue, modified, B7-1 transmembrane domain with modified transmembrane helix. In black, control B7-1 transmembrane helix (e) Impact of the charged amino acids in the transmembrane helix (n ≥ 3, mean ± standard deviation). (f) Impact of the ER export signal in the cytosolic tail. (n ≥ 3, mean ± standard deviation). “-“ = without ER export signal; “+” = with ER export signal
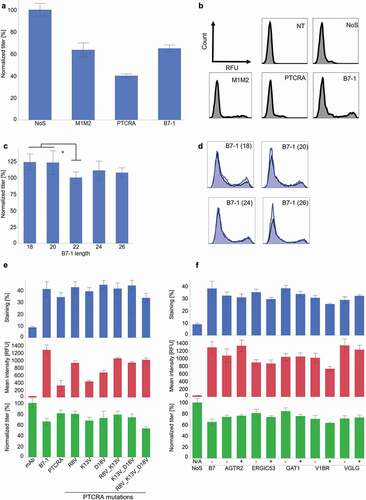
Figure 3. Modifications of splicing recognition sequences. (a) Reduction of pyrimidine content of the poly(y) tract of the intron (n ≥ 3, mean ± standard deviation, *: p < .001 in Tukey–Kramer test). (b) Titer determination after modification of the splice donor site (n ≥ 3, mean ± standard deviation). (c) Surface staining after modification of the splice donor sequence 1 day after transfection. In blue, AS construct. In black, NoS control
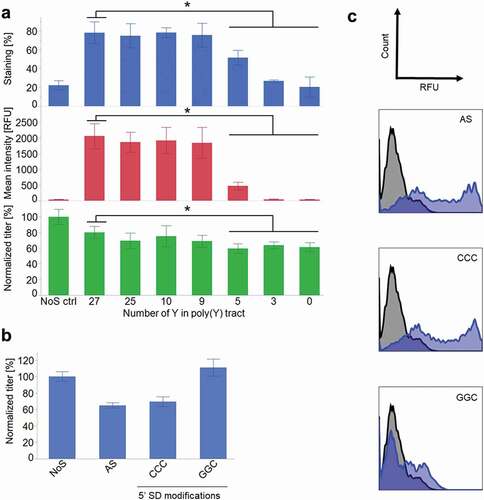
Figure 4. An IgG4 and a bispecific antibody (BEAT®) were expressed in CHO-S cells with and without AS construct. (a) IgG4 titer 4 days after transfection (n ≥ 3, mean ± standard deviation). (b) IgG4 cell surface staining the day after transfection. In blue, AS construct. In black, NoS control. (c) BEAT® titer 4 days after transfection (n ≥ 3, mean ± standard deviation). (d) BEAT® cell surface staining the day after transfection. In blue, AS construct. In black, NoS control
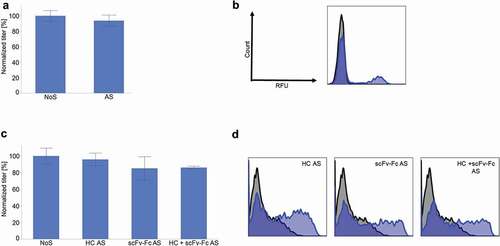
Figure 5. Cell line screening and sorting with AS construct. (a) Stable cell lines expressing an IgG1 with the AS construct were analyzed by cell surface staining and fed-batch assessment for expression level correlation. (b) Example of a stable pool of cells transfected with the AS construct encoding a BEAT®. (c) Stable cell lines expressing a BEAT® with the AS construct were analyzed by cell surface staining and fed-batch assessment for product quality attribute (percentage of BEAT® expressed). (d) Sorting of a stable pool of cells transfected with the AS construct encoding an IgG1. The cells were sorted according to the level of cell surface display. (e) Expression level of the stable clones obtained after cell sorting in (D)
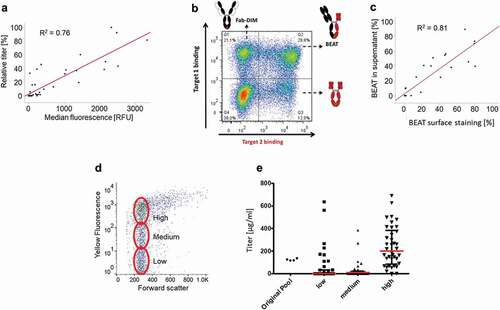
Figure 6. (a) Northern blot analysis. Lanes 1–2: non-transfected cells. Lanes 3–4: clone transfected with the AS construct. Lanes 5–6: control clone transfected with the NoS construct. Lane 7: empty. Lane 8–9: 1 ng and 10 ng, respectively, of the AS construct plasmid. (b) Stability study on three cell lines generated by cell sorting. Upper panel: fed-batch titers over time, relative to P3 value. Lower panel: ratio between short and long transcripts over time. (c) Ratio between short and long transcripts in 42 sub-populations obtained after sub-cloning of a parental cell line population
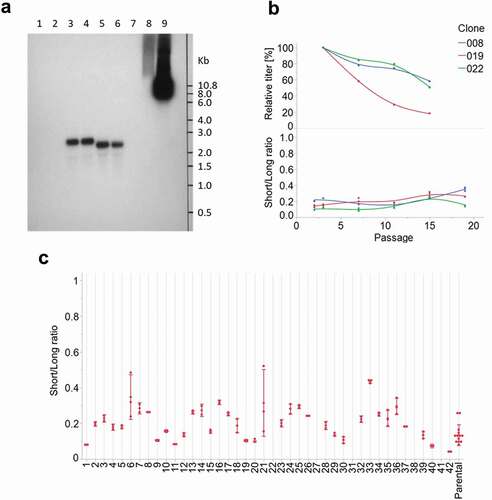
Figure 7. Alanine-scan using the AS construct. (a) Different amino acids of the light chain of an antibody were mutated to alanine. The signal from antibody display (PE signal) was plotted against the binding (APC signal). Three categories of mutations could be detected: no effect (yellow population), moderate effect (orange population) and significant loss of binding (red population). (b) Similar study on the heavy chain amino acids. (c) Structural modeling of the antibody binding pocket: the mutated amino acids are represented with the color of the population they were attributed in the binding experiment (yellow: no effect, orange: moderate effect, red: critical amino acids for binding)
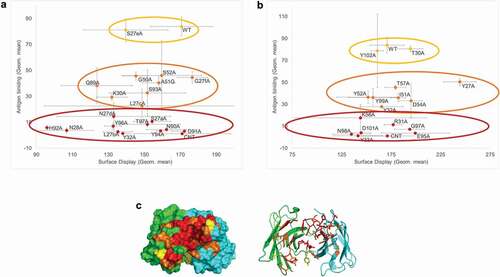
Table 1. Impact of the different elements of the SPLICELECT™ construct on the cell surface display and secretion