Figures & data
Figure 1. Characterization of anti-mouse GIPR antibodies. A) and B) Measurement of the equilibrium dissociation constant (KD) of mAb1 and mAb2 binding to the mouse GIPR membrane by KinExA. C) Effects of mAb1 and mAb2 on the GIP-induced cAMP production assay. D) Summary of bioactivity and binding affinity of the two antibodies. E) Acute in vivo effect of antibodies on insulinotropic effect of exogenous [D-Ala2]-GIP (DAGIP) during IPGTT. Blood insulin and glucose levels were measured after IP DAGIP and glucose challenges in C57BL/6 mice treated with vehicle, DAGIP alone, DAGIP with mAb1 or DAGIP with mAb2. Results are expressed as the mean and standard error of the mean. Statistical analysis was performed using one-way with Dunnett’s test for multiple comparisons. *** p < .001, ** p < .01, * p < .05
![Figure 1. Characterization of anti-mouse GIPR antibodies. A) and B) Measurement of the equilibrium dissociation constant (KD) of mAb1 and mAb2 binding to the mouse GIPR membrane by KinExA. C) Effects of mAb1 and mAb2 on the GIP-induced cAMP production assay. D) Summary of bioactivity and binding affinity of the two antibodies. E) Acute in vivo effect of antibodies on insulinotropic effect of exogenous [D-Ala2]-GIP (DAGIP) during IPGTT. Blood insulin and glucose levels were measured after IP DAGIP and glucose challenges in C57BL/6 mice treated with vehicle, DAGIP alone, DAGIP with mAb1 or DAGIP with mAb2. Results are expressed as the mean and standard error of the mean. Statistical analysis was performed using one-way with Dunnett’s test for multiple comparisons. *** p < .001, ** p < .01, * p < .05](/cms/asset/ccd07451-8a03-465a-8a2d-e67627f1b28f/kmab_a_1710047_f0001_oc.jpg)
Figure 2. Structure of mouse GIPR with Fab1. A) Overall structure of mouse GIPR ECD in complex with Fab1. The GIPR ECD is shown in cartoon representation and colored in rainbow scheme with N-terminus in blue and C-terminus in red. Fab1 is shown in cartoon representation and colored purple for heavy chain and wheat for light chain. B) and C) Detailed interactions in the interface between GIPR ECD and Fab1. Fab1 surface is colored in wheat. The interface residues are shown in sticks and colored as in A. D) Superposition of GIPR ECD-GIP complex structure (PDB access code: 2QKH) with GIPR ECD-Fab1 structure. Fab1 is shown as surface and colored as in A. GIPR ECD is shown in cyan surface. Superposed GIP peptide is shown as yellow cartoon
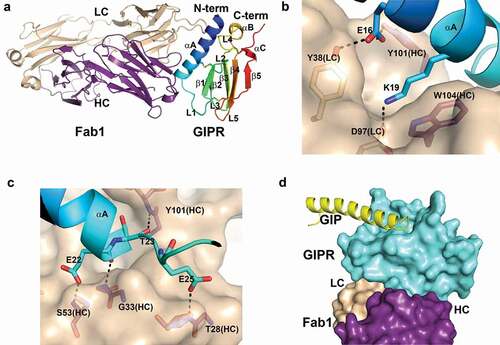
Figure 3. Ternary complex structure of mouse GIPR with Fab1 and Fab2. (A) Overall structure of the ternary complex. GIPR ECD is shown in cartoon representation and colored in rainbow scheme with N-terminus in blue and C-terminus in red. Fab1 is shown in cartoon representation and colored purple for heavy chain and wheat for light chain. Fab2 is shown in cartoon representation and colored blue for heavy chain and light blue for light chain. (B) Overlay of GIPR ECD in the ternary complex structure with Fab2 and Fab1 (rainbow color), in the binary complex with Fab1 (wheat) and in the complex structure with GIP (white). (C) and (D). Detailed interactions in the interface between GIPR ECD and Fab2. The proteins are colored as in (A). The interface residues are shown in sticks. Fab2 surface is colored in light blue
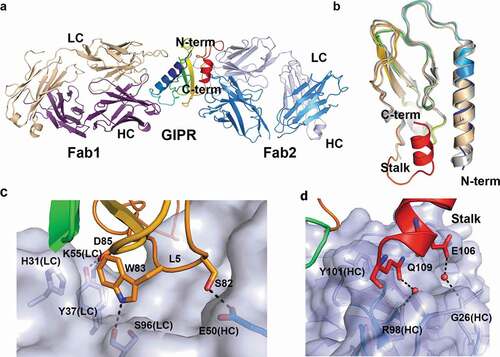
Figure 4. Fab2 stabilizes GIPR in auto-inhibited conformation. (A) Structure superposition of GIPR-GIP complex with GIPR-Fab2 complex. Fab2 is shown in blue surface. GIPR ECD is shown as cyan cartoon with the stalk region colored in red. Superposed GIP peptide is shown as yellow cartoon. (B) The epitope of GIP and Fab2 on the GIPR ECD. The C-terminal stalk of GIPR is removed for comparison with GIPR-GIP structure. GIPR is shown as cyan surface and the GIP is shown as yellow cartoon. The GIP epitope is colored in orange and the Fab2 epitope is outlined in blue. (C) Sequence alignment of the GIPR ECD stalk and GIP peptide presented in a helical wheel. GIPR stalk peptide residues are in red and GIP peptide residues are in black. The three conserved residues are highlighted in cyan shade. (D) Superposition of the GIP peptide to the ECD C-terminal stalk. GIPR ECD with the C-terminal stalk removed is shown as cyan surface. The C-terminal stalk is shown as red cartoon. Superposed GIP is shown as yellow cartoon. The conserved hydrophobic residues are shown as sticks. (E). Comparison of four Class B GPCR-antibody complex structures. GPCR ECD is shown in white surface. The Fabs are shown in cartoon and color in blue (mAb2), cyan (hGIPR-mAb), green (gipg013), and orange (mAb 3F52) respectively. The C-terminal stalk of GIPR ECD is shown in red cartoon
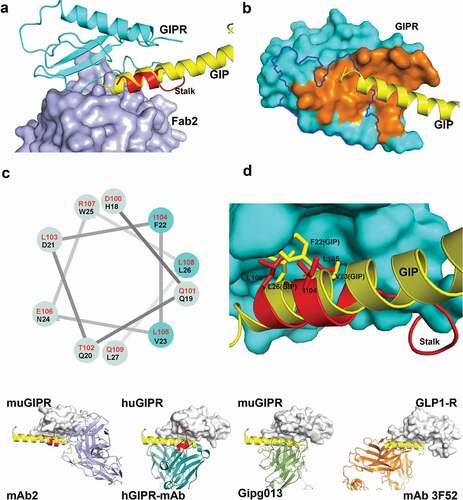
Figure 5. Chronic in vivo studies in DIO mice with anti-mouse GIPR antibodies. DIO mice were treated with the antibodies twice a week via IP injection for 7 weeks. (A) body weight, (B) % of body weight change, (C) glucose level, (D) insulin level, (E) fat mass, (F) lean mass. Results are expressed as the mean and standard error of the mean. Statistical analysis was performed using one-way or two-way ANOVA with Sidak’s test for multiple comparisons. *** p < .001, ** p < .01, * p < .05 vs. mAb1
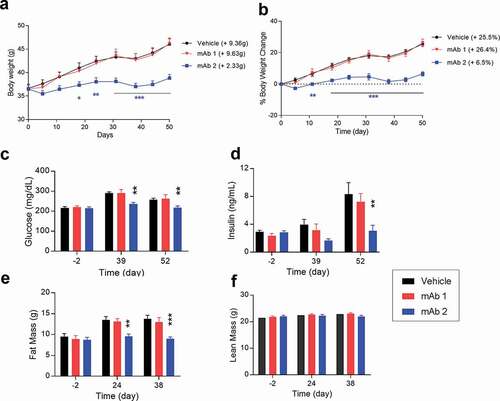
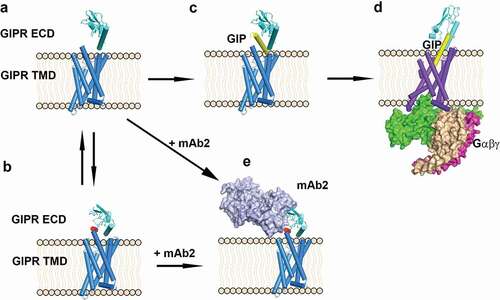
Figure 6. Scheme of antagonist antibody and endogenous ligand GIP-induced conformation changes. (A) GIPR ECD in an open conformation in which the peptide binding site is free. (B) GIPR ECD in an auto-inhibited conformation in which the peptide binding site is occupied by the stalk peptide (red). (C) GIP binds to GIPR ECD, (D) GIP inserted into the GIPR TMD and recruits the G protein complex. (E) Antagonistic antibody mAb2 binds to the GIPR ECD. GIPR 7-helix TMD is shown as blue cylinder. GIPR ECD is shown as cyan cartoon and the stalk region is colored in red. mAb2 is shown as light blue surface and the G-protein complex is shown as magenta/wheat/green surface. The GIP peptide is shown as yellow cartoon. The membrane is shown as beige cartoon