Figures & data
Figure 1. Schematic illustration of the process for generating bsAbs via split intein Npu DnaE. Fab and oaSEED fragments fused to N- or C-terminal split intein were produced separately in mammalian cells and purified. The two fragments were mixed in an equimolar ratio and supplemented with TCEP to activate protein tans splicing (PTS). The bsAb is reconstituted and the mixture was subsequently purified with Ni2+ beads to remove non-reconstituted antibody fragments as well as excised split inteins via hexahistidine tag
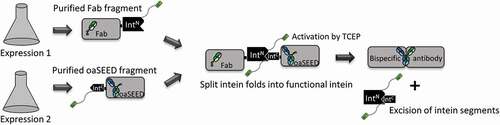
Figure 2. Schematic illustration of protein sequences for heavy and light chains fused to split intein partners IntC and IntN. Protein sequences for heavy and light chains of huFc IgG, Fab and oaSEED fragments with their corresponding molecular weights are exemplarily shown used for antibody reconstitution via split inteins. The partial hinge region is depicted as amino acid sequence fused to ExteinC or ExteinN (underlined) and the corresponding split inteins IntC or IntN. Heavy chains fused to split intein partners were further fused to a hexahistidine tag. Heavy chains fused to IntC were attached to a glycine-serine linker. 1: HC for a huFc IntC fragment. 2 + 3: hu225H Fab IntN HC and corresponding LC. 4 + 5: Reconstituted IgG with modified hinge region aligned to reference IgG. 6–9: B10v5 oaSEED IntC with corresponding HC and LC. Detailed sequence information can be found in the supplements
Figure 3. Antibody reconstitution mediated by PTS using split intein Npu DnaE analyzed by SDS-PAGE. (a) Antibody fragments Fab IntN and huFc IntC were mixed in a ratio 2:1 and incubated for 2 h at 37°C in the presence of 0.5 mM reducing agent TCEP. Samples were taken after every 10 min and analyzed by SDS-PAGE (Lane 1–7). Lane 1 shows antibody fragments Fab-IntN (38.3 kDa) and huFc-IntC (31.7 kDa) under reduced conditions at 0 min. The new band at 49.8 kDa in Lanes 2–7 indicates the reconstituted heavy chains (HCR) of Fab and huFc under reduced conditions. Lane 7 shows complete depletion of antibody fragments Fab-IntN and huFc-IntC after 2 h. (b) Lane 1 illustrates antibody reconstitution with a surplus of Fab-IntN over huFc-IntC (3:1 ratio). Non-reconstituted antibody fragments were still present after 2 h (Lane 2). Non-reconstituted antibody fragments were purified by addition of Ni2+ beads after incubation of 1 h at RT, leaving only the reconstituted antibody (Lane 3, S). Non-reconstituted antibodies were captured by Ni2+ beads (Lane 4, E: Elution with 500 mM imidazole). Final antibody reconstitution was achieved after re-oxidation with DHAA for 2 h at 37°C (Lane 5, Ox.)
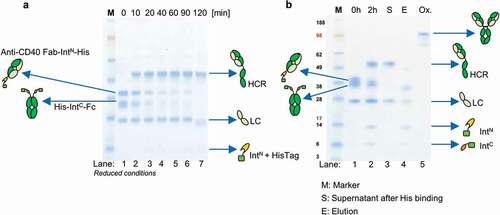
Figure 4. BLI analysis of reconstituted bsAb C5xC6 and comparison to reference C5xC6 binding to soluble CEACAM5 and CEACAM6. KD was determined after association and dissociation of the respective antigens and monitored with varying concentration of analyte over time resulting in an interference pattern shift (nm). (a) Concentration-dependent binding of CEACAM5 and CEACAM6 by reference bsAb version of C5xC6 shows similar kinetic parameters in the nanomolar range compared to reconstituted C5xC6 depicted in (b). (c) Simultaneous binding of soluble recombinant CEACAM5 and CEACAM6 by reconstituted bsAb C5xC6. Both antigens are associated in two steps. EGFR and buffer were used as a negative controls
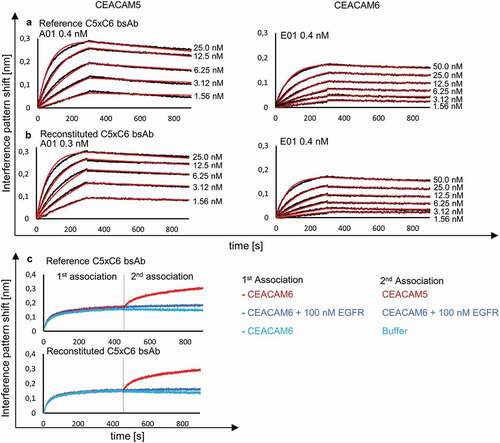
Table 1. Kinetic parameters of reconstituted bsAb compared to parental monovalent oaSEEDbodies and bispecific references. Reconstituted bsAb were compared to their parental monovalent antibodies or bispecific references. Antibodies were captured by anti-human Fc biosensors and subjected to respective antigen binding. Melting temperatures were analyzed by thermal shift assays. (ND, Not defined)
Figure 5. Cellular binding analysis of reconstituted bsAb C5xC6 and corresponding non-reconstituted antibody fragments. Binding to cancer cell line MKN-45 and non-binding to HEK293 cells was analyzed by flow cytometry. MKN-45 cells were incubated with antibodies and detected with Alexa Fluor 488-conjugated anti-human IgG-antibody. Green line: Reconstituted C5xC6; Blue line: C5xC6 Reference; Red line: oaC5-SEED-IntC; orange line: C6-Fab-IntN; Black line: Non-related isotype control (anti-HEL)
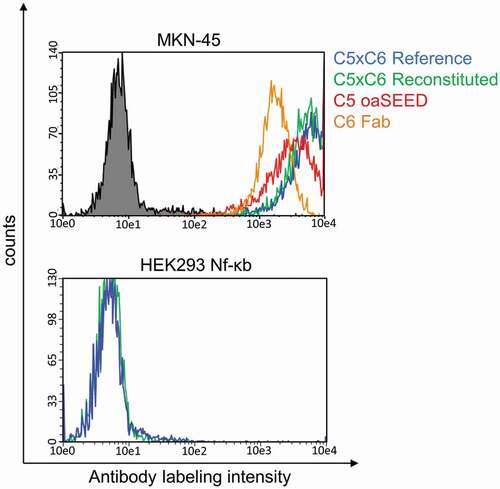
Figure 6. CD40 activation by reconstituted anti-CD40 agonist. CD40-expressing HEK293 cells were treated with different concentrations between 200 nM and 2 pM of reconstituted anti-CD40 IgG1, anti-CD40 IgG2, reference antibody APX005M (used as a positive control) and trastuzumab (used as a negative control) at 37°C, 5% CO2 for 6 h. LPS is known to influence certain cell assays and was used as an assay control up to a concentration of 500 nM. TCEP and DHAA were added in dose concentrations to evaluate false luminescence signal detection. CD40 was activated after treatment with anti-CD40 mAbs and BioGlo Luciferase substrate was added for luminescence readout. Luminescence signal was measured at 0.5 s per well using a sensitivity of 170. The IC50 values were calculated by fitting the dose-response curves using a 4PL with Graphpad Prism software 7
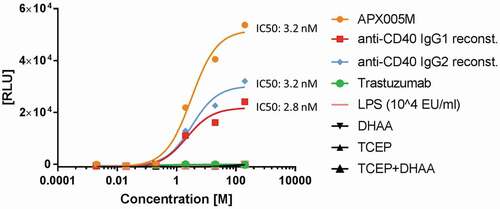
Figure 7. T-cell activation by reconstituted CD3xHer2 bsAbs. SK-BR-3, a Her2-expressing human breast cancer cell line, were used as antigen-presenting cells, and were incubated for 6 h with TCR/CD3 (NFAT) effector cells and reconstituted CD3xHer2 Fab (blue) or CD3xHer2 VHH (green) bsAbs in different concentrations ranging from 0.01 nM to 100 nM. CD3xHer2 binds simultaneously to TCR/CD3 on effector cells and antigen on tumor target cells and stimulates NFAT luciferase activity. BioGlo Luciferase substrate was added for luminescence readout. Luminescence signal was monitored and relative luminescence units (RLU) represent normalized luminescence to untreated cells. Reagents TCEP and DHAA used for bsAb reconstitution were added in different concentration to investigate potential assay interference. Cetuximab (orange): Negative control; monovalent anti-CD3 oaSEED (gray)
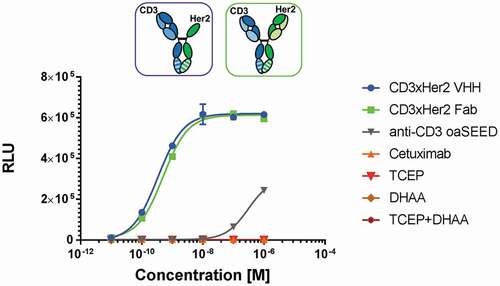
Figure 8. Antibody reconstitution in 96-well format using a surplus of Fab-IntN to demonstrate one-pot purification. A subset of the whole 96-well plate is illustrated. A1: Single anti-CD40 Fab IntN (61.5 kDa). B1: single huFc IntC (63.5 kDa). A2 to A9: Antibody fragments anti-CD40 IntN and huFc IntC were mixed in a ratio 3:1 and PTS was activated by 0.5 mM TCEP. Reconstituted antibodies were separated from non-reconstituted antibodies via Ni2+ beads and further treated with DHAA for reoxidation. Reconstituted anti-CD40 antibodies are indicated at 145.7 kDa under non-reduced conditions. A10-A11: Not treated with Ni2+ beads after reconstitution reaction, resulting in reconstituted anti-CD40 antibody as well as antibody fragments anti-CD40 IntN and huFc IntC. A12 and B12: Antibody fragments anti-CD40 IntN and huFc IntC after TCEP treatment without the addition of Ni2+ beads and DHAA (control). Gel band at 1 kDa (green): Lower Marker (LM). Blue band below 16 kDa: System Peak. The whole gel panel of the 96-well plate analysis is shown in Figure S12
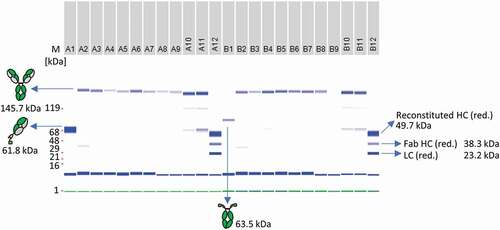
Figure 9. Antibody reconstitution in 384-well format fully automated by BiomekFX HTS platform. Antibody reconstitution was conducted in 386 wells by mixing anti-CD40 Fab IntN with huFc IntC in a 2:1 molar ratio, resulting in a final volume of 40 µL with a total protein amount of 14 µg, followed by addition of 0.5 mM TCEP for PTS activation. Non-reconstituted antibody fragments were removed by magnetic Ni2+ bead addition and reconstituted anti-CD40 antibodies were supplemented with a 10-fold molar excess over TCEP with DHAA for reoxidation. (a) ELISA readout of reconstituted anti-CD40 antibodies (e-v) derived from 384-well plate generated by fully automated BiomekFX HT platform. Each column from E to V represents a cluster of 16 wells including the mean with standard deviation for each cluster. The heat map shows signal detection at 450 nm after ELISA was performed for each well in the 384-well plate. An antibody concentration of 0.1 µg mL−1 was used for ELISA analysis. (b) CD40 activation assay was performed to evaluate cellular functionality of reconstituted anti-CD40 antibodies derived from high throughput reconstitution. Human CD40-expressing HEK293 cells were treated with 4 nM reconstituted antibodies (E-V) and 200 nM APX005M (positive control) for 6 h, activating an engineered NF-κB pathway for luciferase transcription. Luminescence signal was recorded and relative luminescence units (RLU) is representing normalized luminescence to untreated cells. 200 nM trastuzumab was used as a negative control, showing no CD40 activation. The heat map shows CD40 activation for each single well on the plate. Error bar: Mean with standard deviation (SD)
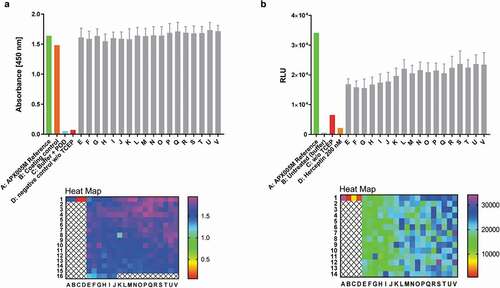
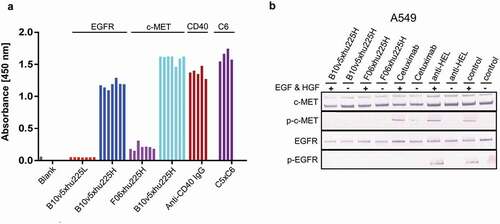
Figure 10. Combinatorial bsAb antibody screening. Several bsAbs B10v5xhu225L, B10v5xhu225H, F06xhu225H, anti-CD40 IgG and C5xC6 have been reconstituted in plate format as described before, to prove suitability as a screening platform based on higher and lower affinity profiles. (a) Reconstituted bsAbs were analyzed by ELISA and detected after binding to corresponding antigens with POD-labeled anti-human Fc secondary antibody. The 4–7 bars in represent replicants for reconstitution reproducibility. (b) Functionality of reconstituted c-METxEGFR bsAbs was demonstrated by inhibition of c-MET and EGFR phosphorylation. A549 cells with high to moderate c-MET and EGFR expression levels were incubated with 300 nM bsAb after starvation and treatment with and without 100 ng mL−1 EGF and HGF. Phosphorylated c-MET and EGFR was detected by specific AP-labeled phospho-c-MET or phospho-EGFR secondary antibodies after cell lysis with RIPA buffer followed by SDS-PAGE and western blot analysis. Cetuximab was used as a positive control for EGFR phosphorylation inhibition, while anti-HEL was used as a negative isotype control