Figures & data
Figure 1. HIC overlays of heat-stressed Combo (profile A) and HIC-fractionated mAb-A (profile C) and mAb-B (profile B). Vertical lines in Profile A indicate fractionation times. Each fraction of HIC-separated Combo (profile A) was reinjected on HIC to verify enrichment (profile B and profile C). Heat-stressed Combo at 40°C for 3 months is shown
Figure 2. Comparison of size variant profiles for (a) mAb-A and (b) mAb-B. Profiles A, mAb-A, and mAb-B; profiles B, mAb-A, and mAb-B fractionated by HIC from Combo; profiles C, Combo by HPSEC and gel electrophoresis (nonreducing and reducing). HC = heavy chain; LC = light chain
Table 1. Deamidation in Combo, mAb-A and mAb-B fractions by HIC, and mAb-A and mAb-B
Figure 3. Comparison of charge variant profiles for (a) mAb-A and (b) mAb-B. Profiles A, mAb-A and mAb-B; profiles B, mAb-A and mAb-B fractionated by HIC from COMBO; profiles C, Combo by IEC and cIEF. Rectangular area is magnified in inset of (b) IEC profiles
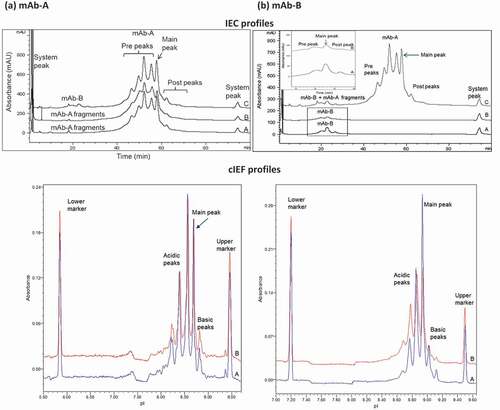
Figure 4. Results of SPR binding assay for detection of coaggregates of mAb-A and mAb-B. Positive control of coaggregates fractionated by HPSEC was obtained from a 1:1 mixture of mAb-A and mAb-B incubated at 50°C for 33 days (black solid line). Shown are aggregate fractions by HPSEC from nonstressed Combo (green solid line) and Combo incubated at 40°C for 3 months (green dotted line)
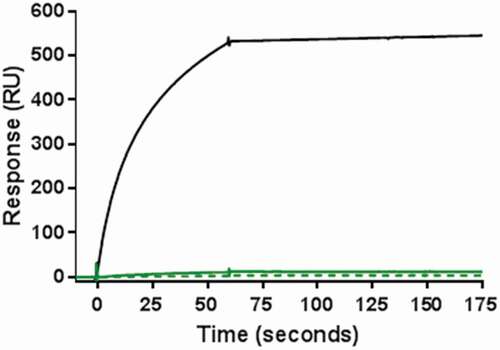
Table 2. Observed post-translational modifications of Combo, mAb-A and mAb-B under stress conditions
Figure 5. Higher-order structure profiles of experimental mAb-B and mAb-A, Combo, and reconstructed Combo by (a) DSC, (b) far UV CD, (c) near UV CD, and (d) FTIR. Profile A, mAb-B (red); profile B, mAb-A (blue); profile C, experimental Combo (black); profile D, reconstructed Combo (gray)
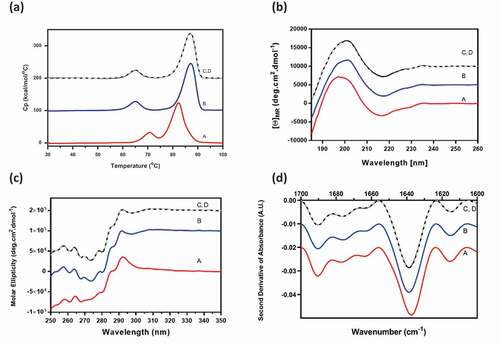
Figure 6. AUC profiles for evaluating intermolecular interactions of mAb-A and mAb-B in Combo. (a) Comparison of AUC profiles of mAb-A, Combo, and a positive control of intermolecular interactions (a:b mixtures of mAb-A and anti-mAb-A antibody). Profile A, mAb-A (red); profile B, Combo (blue); profile C, positive control (a:b mixtures of mAb-A and anti-mAb-A antibody; black). (b) Impact of Combo concentration on ls-g*(s) sedimentation profile. Profile A, Combo at 0.2 mg/mL (red); profile B, Combo at 0.5 mg/mL (blue); profile C, Combo at 2 mg/mL (black). (c) Impact of mAb-A:mAb-B ratio on ls-g*(s) sedimentation profile. Profile A, a:b mixture of mAb-A and mAb-B (red); profile B, 4:1 mixture of mAb-A and mAb-B (blue); profile C, 1:1 mixture of mAb-A and mAb-B (black)
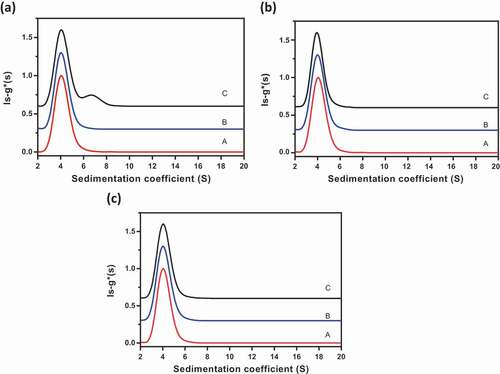
Figure 7. ITC profiles by titration of mAb-B in mAb-A
Table 3. Comparison of hydrodynamic diameters for monomer and dimers in Combo
Figure 8. Comparison of average hydrodynamic diameters by DLS with increasing protein concentrations
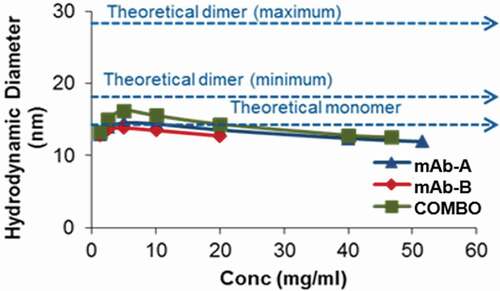
Figure 9. Representative dose–response curves for (a) mAb-A and (b) mAb-B bioassay of Combo and mAb-A and mAb-B