Figures & data
Figure 1. The workflow for online CEX-UV-MS and top-down analyses. CEX provides separation and isolation of protein charge variants. The mass measurement of each charge variant separated by CEX can be achieved by online MS analysis. A post-column addition is introduced to increase the sensitivity of CEX-MS and to facilitate top-down analysis of mAbs. The LC-UV and LC-MS elution profiles of the charge variants, accurate mass, and top-down fragmentation facilitated site-specific structural analysis. See text for details
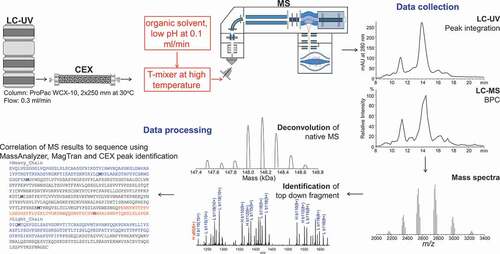
Figure 2. (a) Measured pH values of the collected 0.3 mL fractions eluting every minute from the CEX column during theoretical linear pH gradient of pH 5–9.5 (1%-100% B) between 1 and 19 min used for analysis of the Fc-fusion protein (with theoretical pI 8.5). (b) Measured pH values of the collected 0.3 mL fractions eluting every minute from the CEX column during linear pH gradient of pH 5.77–5.95 (15%-19% of pH 5–9.5 B) between 1 and 40 minutes used for analysis of the mAb (with theoretical pI 8.0). CEX profile of the antibody is overlaid. Buffer A: 50 mM ammonium acetate adjusted with acetic acid, pH 5. Buffer B: 50 mM ammonium acetate adjusted with ammonium hydroxide, pH 9.5
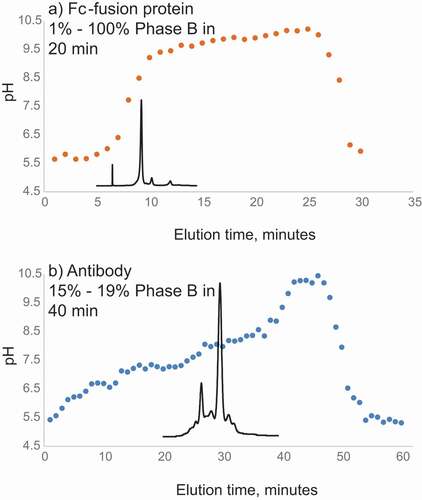
Figure 3. (a) Top-down fragmentation mass spectra after in-source collision induced dissociation of the multiply charged antibody ions. Ion intensities are on the top right corners. Aqueous CEX eluent at 0.3 ml/min electrosprayed directly (top panel) and post-column T-mixed with the organic-containing, acidic solvent at 0.1 ml/min (middle to bottom panels). Top-down analysis was performed by increasing in-source voltage and fragmenting all entering multiply charged protein ions. The column was at room temperature, unless specified on the figure. (b) Electrospray ionization mass spectra including multiply charged ions of an intact antibody from native aqueous CEX condition (top), different post-CEX conditions (middle), offline direct infusion (bottom), and RP LC-UV-MS (bottom). Ion intensity values are on the top right corners. The numbers with plus sign indicate charge states. Other conditions are shown in the figure
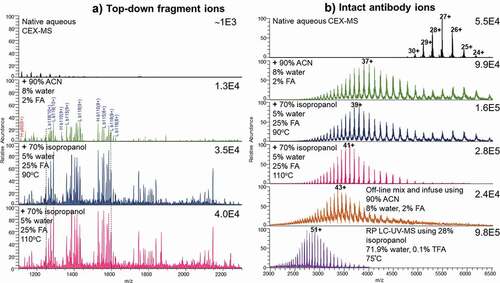
Figure 4. (a) CEX-UV profile of a bispecific antibody from two samples that have different degrees of purification before CEX-UV-MS analysis. The UV profile of antibody after only one-column (protein A column) purification is shown in dash line, and the UV profile of antibody after two-column purification is displayed in solid line. (b) CEX-MS profile of the bispecific antibody after only one-column purification. The desired form and impurity were identified based on MS measurement
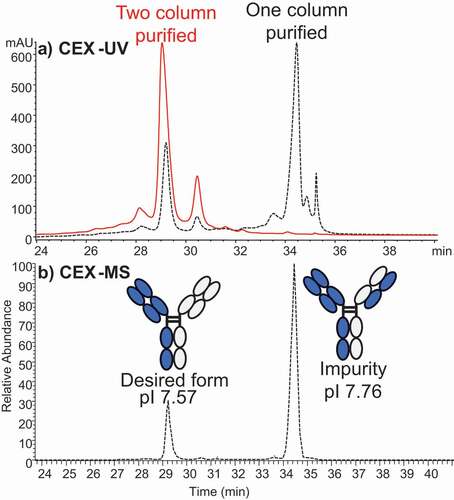
Figure 5. (a) CEX-UV profile of an Fc-fusion protein and (b) deconvoluted mass spectra of each peak in the CEX-UV profile of the Fc-fusion protein. In panel (a), the cartoon of the Fc-fusion protein represents the assignment of each peak based on MS measurement
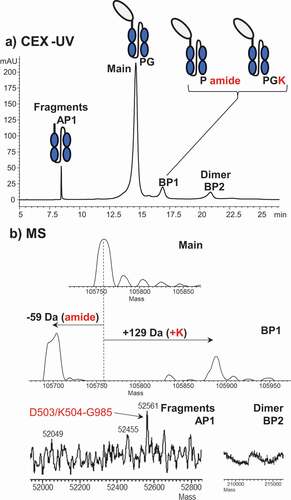
Figure 6. CEX-UV profiles with detection at 280 nm and CEX selected ion chromatograms (SIC) for top-down fragments of the control antibody (dash) and after 1-h stress by 0.1% hydrogen peroxide (bold solid line). Maximum ion intensities are shown at the top right of SEC plots. SIC of M4 Ox was elevated (not to scale) to better visualize the elution time. Ion intensity should be used for quantitation
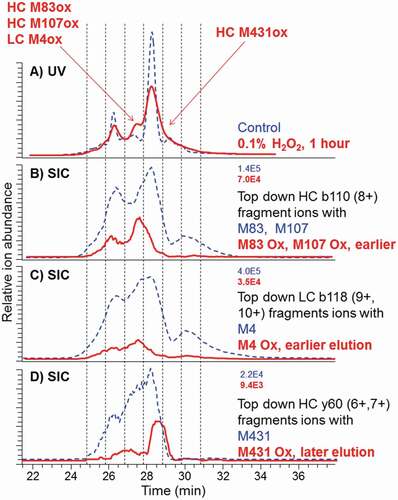
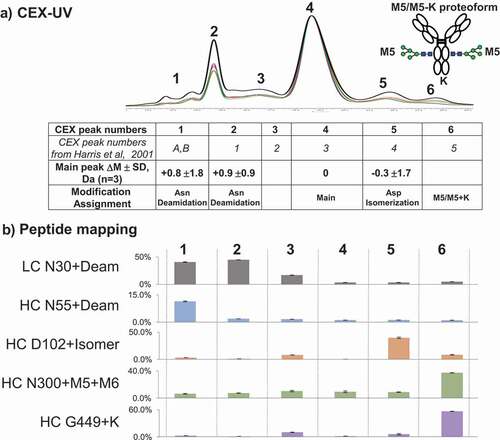
Figure 7. (a) CEX-UV profile and peak assignment of mAb. Different colors are used to represent different batches of mAb: black bold lotM586268; red lot3072991; and green lot3044033. Each CEX-UV peak is assigned based on the MS measurement, and the peak assignment is summarized in the table below. In the table, Asp isomerization represents the isomerization of Asp into isoaspartic acid. The table also compares the peak assignment in this work with the previous results from Harris et al. A cartoon of the antibody proteoform with high mannose and C-terminal K (M5/M5 + K) represents CEX peak 6. (b) peptide mapping results of each CEX-UV peak of mAb. Percentages of main modifications in each CEX-UV peak are shown as bar graph