Figures & data
Figure 1. Generation of truncated EBOV GPs. (a) Design of truncated EBOV GPs. GP includes the signal peptide (SP), Base, Head, glycan cap (GC), mucin-like domain (Mucin), internal fusion loop (IFL), heptad repeat 1 (HR1), heptad repeat 2 (HR2), and transmembrane (TM) domain. The same color-coding is used also for a three-dimensional model of GP (PDB ID: 3CSY). (b) Expi293 expression supernatants of truncated EBOV GPs were identified using anti-6× His tag pAb-HRP by western blotting. Lane 1: GP133-501; 2: GP∆Muc33-310; 463–632; 3: GP33-310; 463–558; 4: sGP33-295; 5: GP33-227; 6: GP33-158; 7: GP95-295; 8: GP158-295; 9: GPcl. (c) Soluble GP∆Muc was digested by thermolysin to generate GPcl. Lanes 1–2: GP∆Muc; 3: Thermolysin; 4, 5: GP∆Muc incubated with thermolysin; 6: GP∆Muc-thermolysin mixture retained by a 50-kDa cutoff filter; 7, 8: GPcl collected by a Superdex 200 Increase 10/300 GL column; 9: Removed impurities. Symbols “+”, “-” indicate reduction or not with dithiothreitol (DTT)
Figure 2. Isolation of GP-specific monoclonal antibodies. (a) Binding capacity of the serum of vaccine-immunized subjects # 024, 057, and 088 to EBOV GP, BDBV GP, and SUDV GP. Values represent the difference in optical density (OD) between sera (1:10,000) on day 28 post-boost immunization and day 0 from the same donor. See also Figure S1a. (b) Neutralizing capacity of the serum of vaccine-immunized subjects # 024, 057, and 088 against pseudotyped HIV-EBOV GP-Luc. Data on the curve represent the difference in neutralization ability between sera on day 28 post-boost immunization and day 0 from the same donor. (c) Sorting of CD3−/CD38−/IgG+/CD19+/CD27+/GP∆Muc+ single memory B cells obtained from PBMCs one month post-boost immunization to identify GP-specific mAbs. (d) Number of specific or cross-reactive antibodies identified using the supernatants of Ig genes linear expression cassettes. See also Figure S1b. (e) Correlation between GP sequence similarity to EBOV GP and number of binding antibodies. (f) Number of antibodies binding to different truncated EBOV GPs determined by ELISA using 293 T supernatants. See also Figure S1b
Figure 3. Analysis of EBOV GP-specific antibody sequences. See also Figure S2. (a) Antibodies with the same VH germline genes were grouped and their CDR3 s are listed. Bold letters indicate identical or conserved amino acids, whereas gray letters denote amino acids with different characteristics. (b) Heavy (top) and light chain (κ/λ, bottom) variable region gene family distributions of GP-specific antibodies. (c) Number of nucleotide (Nt) and amino acids (AA) mutations in VH and VL genes. (d) CDR length of VH and VL genes. Mean ± SD are shown in red. (e) Multiple alignment of VH, Vκ, and Vλ of mAbs depicted by WebLogo 3. CDR regions are highlighted
Figure 4. Profiles of antibody binding and neutralizing abilities. (a) EC50 and IC50 values of the identified antibodies binding to Ebola virus GPs, truncated EBOV GPs, and HIV-EBOV. See also Figure S3 and Figure S4a. (b) Binding curves of mAb 2G1 to ebolavirus GPs or truncated EBOV GPs. (c) Neutralization of authentic EBOV/May-eGFP by nAbs; corresponding IC50 values are shown. (d) Neutralization of cross-reactive mAbs or Fab to HIV-EBOV/BDBV/SUDV GP-Luc; corresponding IC50 values are shown. Binding and neutralization assays were performed in duplicate or triplicate
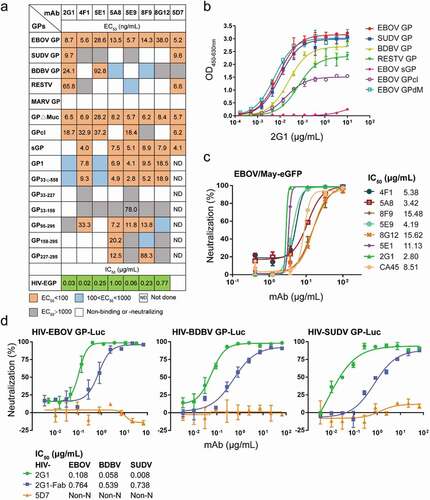
Figure 5. Competition assays and epitope prediction. (a) Competition assays. Numbers represent the percentage binding of biotinylated mAbs in the presence of a competitor versus an irrelevant mAb. Values <30 (white numbers in black grids) indicate mAbs with an identical or close epitope; values >60 (white boxes with black numbers) indicate noncompetitive mAbs; values in the 30%~60% range (black numbers in gray grids) indicate intermediate binding ability. MIL77-1/2/3 are abbreviated as M-1/2/3. G1 to G5 represent five groups with different binding areas (red squares); seven nAbs are highlighted by green squares. (b) Mapping of predicted critical amino acids of nAbs on a GP model (PDB ID: 5KEL). See also Figure S5
Figure 6. Influence of GP form and thermolysin cleavage on mAbs binding. (a) Binding of mAbs to EBOV GP displayed on the surface of BHK-T7 cells. Images were acquired under a 4× objective on a Cytation imaging reader. (b) and (c) Binding of mAbs to uncleaved or cleaved EBOV GP/GP∆Muc displayed on the surface of 293 T cells and analyzed using flow cytometry. Fold change in mAb binding after thermolysin cleavage was calculated by comparing the percentage of PE-positive cells with or without thermolysin (THL) digestion. See also Figure S6 and Figure S7. (d) NPC1-C binding inhibition. See also Figure S4b
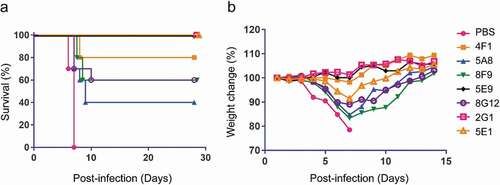
Figure 7. Survival and weight change of mice treated with EBOV mAbs. (a) BALB/c mice (n = 10 per group) were inoculated with mouse-adapted EBOV, treated with PBS or 100 μg nAbs at one day post-infection, and monitored for 28 days. (b) Weight change of mice after virus challenge and mAbs administration. Mice were monitored for 14 days