Figures & data
Table 1. Critical molecule properties and analytical assays used during sequence selection and developability assessment
Figure 1. Drug discovery, sequence selection, and developability workflow
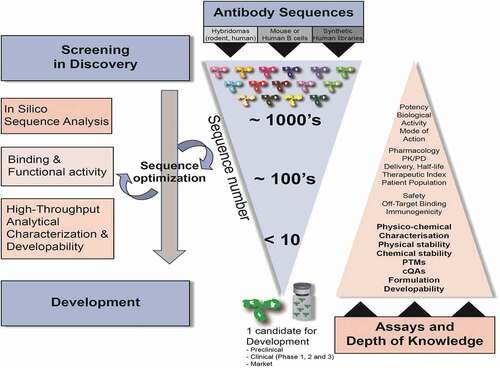
Figure 2. High-Throughput Analytical Characterization, Developability, and Data Management System
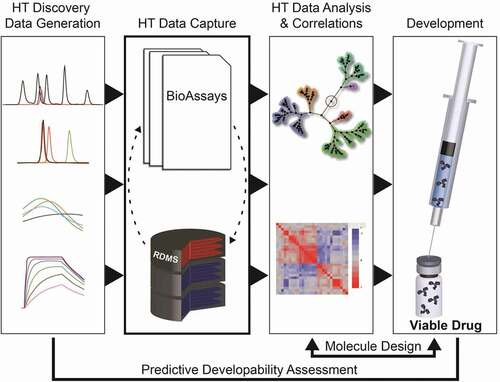
Figure 3. a Distribution plots of physicochemical properties of 152 monoclonal antibodies from multiple biophysical assays. The box and whisker plot to the right of each panel indicates the distribution of the properties which were evaluated. The box runs from the 1 st to the 3rd quartile, with the center line at the median. Whiskers extend to the farthest points from the box not more than 1.5 interquartile ranges from the box. A 95% confidence diamond is given for the mean. The red bracket outside the box marks the shortest regions that includes 50% of the observations. b Correlation clustered colored map of Spearman correlations (ρ). Negative correlations between assays (−1 to 0) are shown in a blue rectangle. Positive correlations (−1 to 0) are shown in a red triangle. c Protein property descriptors and HIC predicted retention times (HIC RT-PRED) vs. HIC RT for the 152 tested sequences. HIC RT expressed in minutes is the x-axis throughout. Antibodies that did not elute were set to the maximum of 50 min. Pearson correlation r2 for HIC RT vs the indicated descriptor is reported on each scatter plot. i) The upper panel plots HIC RT-PRED colored by patch_cdr_ion and its associated binned histogram. ii) The average sum of the ensemble surface area patches for the whole Fab (patch), and CDR (patch_cdr) for each of hydrophobic (hyd) and ionic (ion) on the homology model are indicated and colored by the HIC RT-PRED as derived from the QSPR-4pt model equation as is its associated histogram
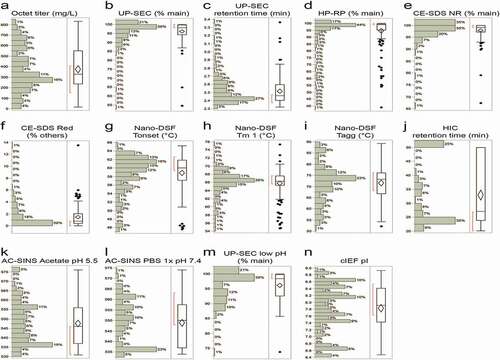
Figure 3. (Continued)
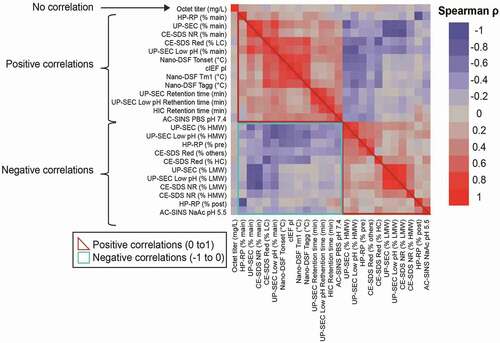
Figure 3. (Continued)
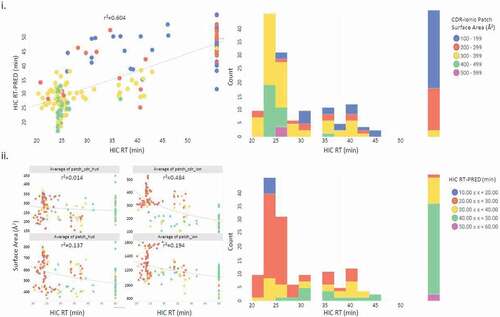
Table 2. Spearman correlations (ρ > 0.5) for selected analytical characterization read-outs with p-values <0.0001. Pearson coefficients and associated p-values are also shown. P-values test null hypothesis that the correlation coefficient = 0
Figure 4. Distribution plots of selected physicochemical properties for panel 152 monoclonal antibodies segregated in IgG1 s and IgG4 s. a-% of main peak by UP-SEC after protein A purification b- % of main peak by UP-SEC after low pH stress, c- Tonset by nano DSF, λmax shift by AC-SINS in acetate pH 5.5, e- pI by cIEF. Color of the dots in Figure 4 a-e indicates different molecules properties: green color indicates % of mean peak by UP-SEC >95%, Tonset >65°C, λmax by AC-SINS <540 nm, (pI>7.5) f- dendrogram of properties for mAb panel segregated by isotype (IgG1 s and IgG4 s) g- Dendrogram highlighting three mAb clusters (Cluster 1, 2, and 3). 100% of IgG1s are found in cluster 3, while IgG4 s are found in clusters 1 and 2
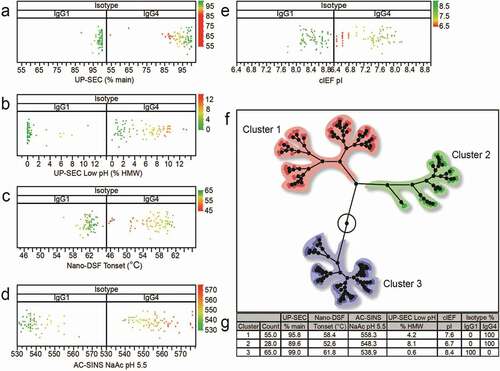
Table 3. Spearman correlations (ρ > 0.5) for selected analytical characterization read-outs with p-values <0.0001 separated by isotype (IgG1 and IgG4). Pearson coefficients and associated p-values are also shown. P-values test null hypothesis that the correlation coefficient = 0
Table 4. Experimental and predicted HIC retention times for selected mAbs. Included are the 4 contributing properties which compose the 4-Pt QSPR equation resulting in the predicted retention times. r2 values for each column vs. HIC RT are displayed in the final row
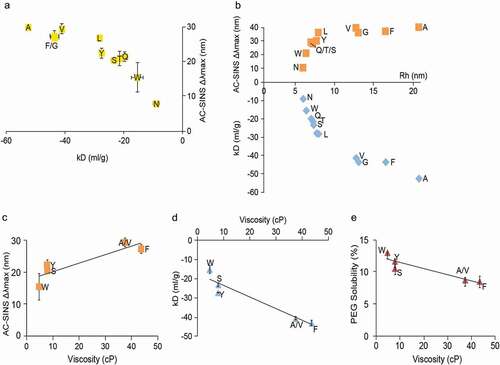
Figure 5. UP-SEC, HIC, and molecular surface analysis of a family of affinity matured antibodies. a- UP-SEC, b- HIC, c- Plot of retention times (RT) by UP-SEC vs. HIC,d- Surface patch analysis using homology models of affinity matured mutants (mAb32,15,22,23,19,40, and 24) e- Overall biophysical properties (UP-SEC, HP-RP, CE-SDS, Tm/Tagg, HIC, SINS, low pH hold UP-SEC, cIEF) for mAb 40
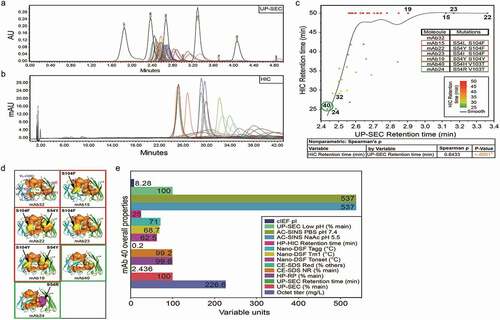
Figure 6. Case Study mAb A and humanized variants
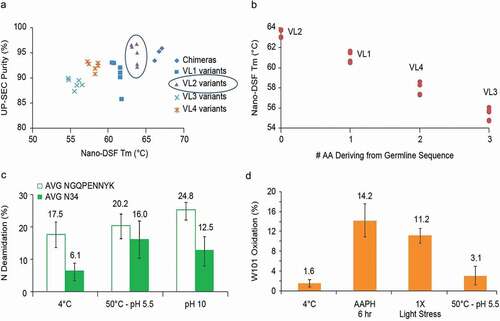
Figure 7. Case study Humanized mAb A incorporating variants with higher isoelectric point
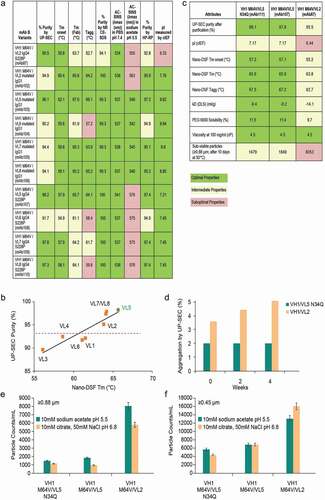
Figure 8. Case study Humanized mAb B: Analytical characterization and homology model
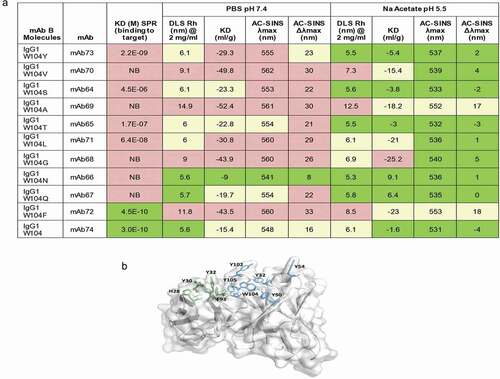
Figure 9. Case study Humanized mAb B: correlating HT predictive self-association methods with CMC endpoints for W104 and selected W104X variants formulated in PBS pH 7.4