Figures & data
Figure 1. Results of dose escalation PET imaging with 89Zr-labeled IBI322. Maximum intensity projections (MIPs) of a humanized transgenic mouse (B-hCD47; genotype: h/h) bearing an MC38 tumor (hCD47 and hPDL1) (above) and coronal (middle) and transverse (below) tomograms of the tumor at 168 h. The white arrow indicates the ROI of the liver, the white dotted line indicates the ROI of the tumor, and the purple dotted line indicates the ROI of the spleen (a). Images are parameterized as %ID/g. Time-activity curves of the heart (b) and tumor (c) for each group. (d) The tumor/muscle ratios of each group at 168 h. **: p < .01, group 1 vs group 2, ##: p < .01, group 2 vs group 3, &&&: p < .001, group 1 vs group 3. Histograms of liver (e) and spleen (f) uptake for each group. *: p < .05, 2 h vs 168 h, **: p < .01, 2 h vs 168 h, ***: p < .001, 2 h vs 168 h
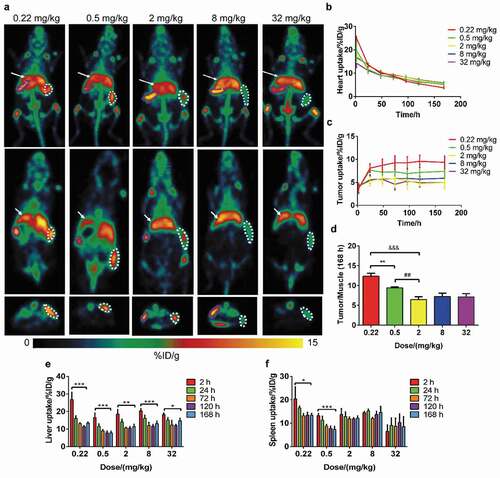
Figure 2. Results of the safety assessment from dose escalation PET imaging. The body weights of each group over the 7 d after administration (a). Histograms of liver (b) and spleen (c) uptake after intravenous injection of 89Zr-labeled IBI322. H&E staining of liver and spleen sections from each group. (Scale bar: 200 µm) (d). The black arrow indicates partially necrotic regions of the spleen
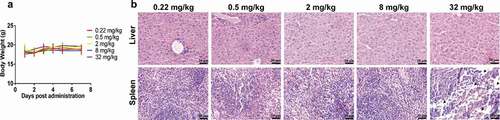
Figure 3. Biodistribution results. Tissue uptake (%ID/g) with the administration of 0.5 mg/kg 89Zr-labeled IBI322 at 72 h and 168 h in transgenic mice (B-hCD47; genotype: h/h) bearing an MC38 tumor (hCD47 and hPDL1) (a). CD47 and PD-L1 IHC staining and H&E staining of the tumors (Scale bar: 200 µm) (b). Black arrow indicates positive expression
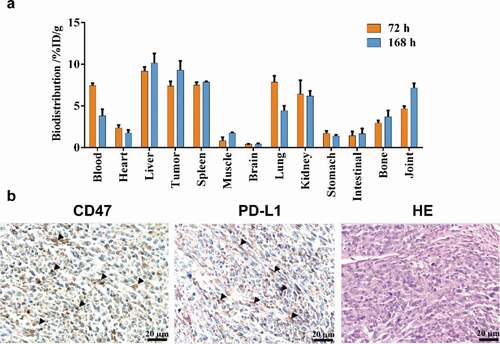
Table 1. Dose escalation study design (n = 4)
Table 2. Pharmacokinetics parameters
Figure 4. Results of the pharmacokinetics study. Curves show the serum concentration/blood and heart equivalent concentration over time analyzed by ELISA, radio detector, and PET imaging, respectively (a). (b to d) Pearson correlation analysis and linear regression fitting curves along the serum concentration (ng/mL) by ELISA, the blood uptake (%ID/g) determined by radio detector, and the heart uptake (%ID/g) determined by PET imaging. The dotted line represents the 95% confidence interval
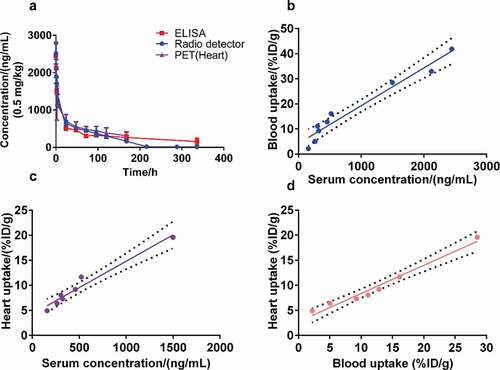
Table 3. Fitting parameters of each group with the modified Patlak model
Figure 5. Modified Patlak plots for all dose groups (a-e) and dose-dependent tumor engagement curve (f)
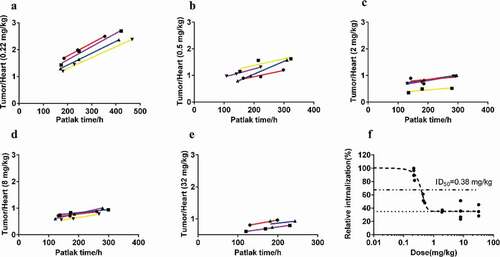
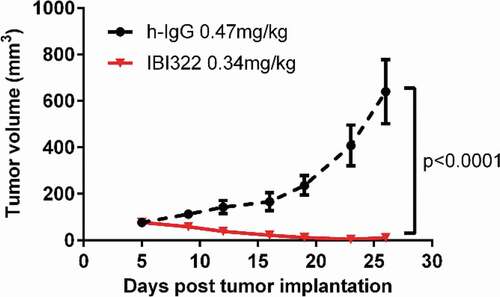
Figure 6. Preliminary pharmacodynamic results in NOD/SCID models bearing Raji/PD-L1 tumors (n = 6)