Figures & data
Figure 1. Biomanufacturing diagrams for Process A (conventional fed-batch at 1000-L scale, n = 5), Process B (intensified fed-batch by enriched N-1 at 1000-L scale, n = 8), and Process C (intensified fed-batch by perfusion N-1 at 2000-L scale, n = 3).
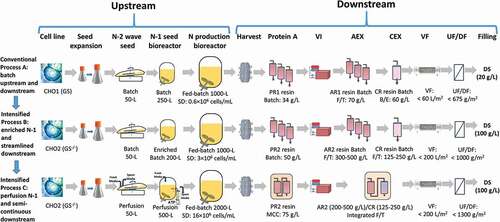
Figure 2. N-1 seed culture profiles (a) VCD; (b) cell viability and fed-batch production culture performance profiles; (c) VCD; (d) cell viability; (e) normalized titer; (f) normalized cell-specific productivity in the mAb biomanufacturing using Process A (n = 5), Process B (n = 8), and Process C (n = 3). Values are reported as average ± standard deviation.
Figure 3. Scale-up related metabolites and parameters: (a) lactate; (b) NH4; (c) CO2; (d) osmolality; for fed-batch production Process A (n = 3), Process B (n = 8) and Process C (n = 3). There are only triplicate data available for lactate, CO2, and osmolality out of five Process A batches, while no NH4 data available for Process A. Values are reported as average ± standard deviation.
Figure 4. Product yields at different downstream steps in the mAb biomanufacturing using Process A (n = 5), Process B (n = 8), and Process C (n = 3). Values are reported as average ± standard deviation. N/A, not applicable.
Figure 5. In-process quality attributes: (a) HMW; (b) HCP; (c) DNA; (d) rProA; at different downstream steps in the mAb biomanufacturing using Process A (n = 3), Process B (n = 3), and Process C (n = 3). *Below detection limit. Values are reported as average ± standard deviation.
Figure 6. Quality attributes (charge variant species, N-linked glycans, SEC impurities and ELISA potency) for final DS batches manufactured with Process A (n = 5), Process B (n = 8), and Process C (n = 3). Values are reported as average ± standard deviation.
Table 1. Assumptions for COG Analysis.
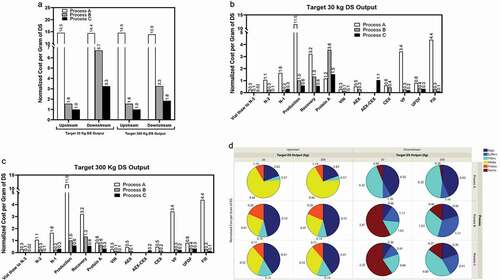
Figure 7. Consumables (resins, filters, bags, media, buffers, and probes) costs for Process A, Process B, and Process C assumed to be all at 2000-L bioreactor scale: (a) upstream and downstream; step costs for (b) 30 kg and (c) 300 kg DS output, respectively; (d) breakdown cost.