Figures & data
Figure 1. HPSEC-UV profile of the roledumab preparation (black trace) and the purified dimer fraction (red trace). Separation is performed on a Superdex 200 column at a flow rate of 0.4 mL/min using an isocratic-elution with PBS. Detection at 280 nm.
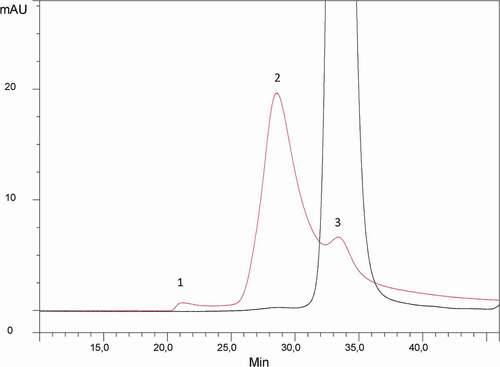
Figure 2. CE-SDS profiles of the purified HMW fraction with (black trace) and without (red trace) reduction by DTT. Peak assignments: LC: Light Chain (25 kDa), HC: Heavy Chain (50 kDa), mAbs without one LC: HHL (125 kDa) and without two LC: HH (75 kDa). Conditions: uncoated silica capillary, 50 µm I.D., 50/60 cm effective/total length, BGE: SDS-MW Gel Buffer at pH 8.0 with 0,2% SDS, −15 kV, 40°C, UV detection at 280 nm. IS: internal standard is a 10 kDa protein.
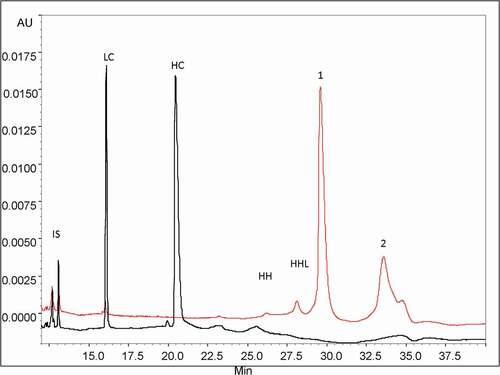
Figure 3. UPSEC-UV chromatogram obtained from the HMW fraction (a). Native mass spectra of peaks 1 (b), 2 (c), 3 (d) and 4 (e), respectively obtained by UPSEC-MS. Theoretical mass of the G0/G0 glycoform of roledumab is 149,778 Da.
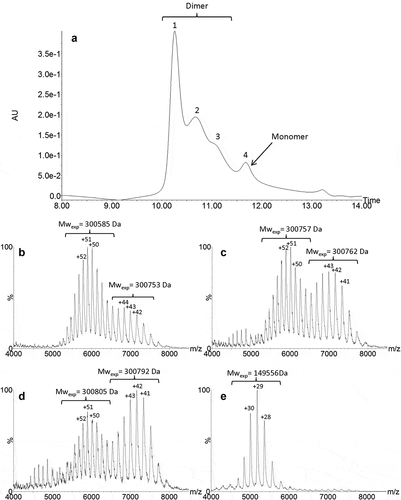
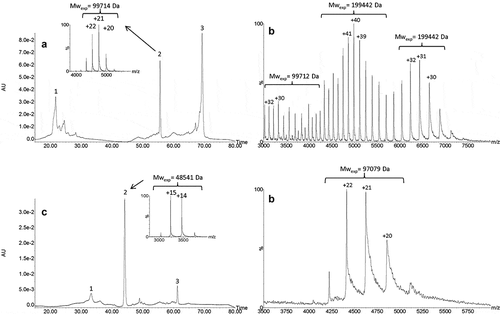
Figure 4. UPSEC-UV-MS chromatogram of the isolated HMW fraction submitted to IdeS enzymatic digestion (a). Native mass spectra of peaks 1 (b), 2 (c), 4 (d) and 5 (e) obtained by UPSEC-MS. See conditions in Figure 3. Theoretical masses of F(ab’)2, F(ab’)2 dimer and Fc are 199,412 Da, 99,706 Da and 50,108 Da, respectively.
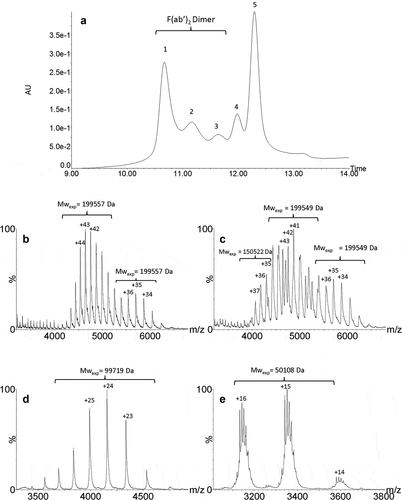
Figure 5. IEX-UV profile of the isolated HMW fraction (a). Native mass spectra of peaks 1 (b), 3 (c) and 4 (d). Conditions: MAbPac SCX-10 column, mobile phases were 50 mM ammonium formate, at pH 3.9 (Buffer A) and 500 mM ammonium acetate at pH 7.4 (Buffer B). Gradient elution at a flow rate of 0.4 mL/min: 15% of B for 5 min, 15% to 31% in 40 min, 31% to 85% of B in 30 min. UV detection was set at 280 nm.
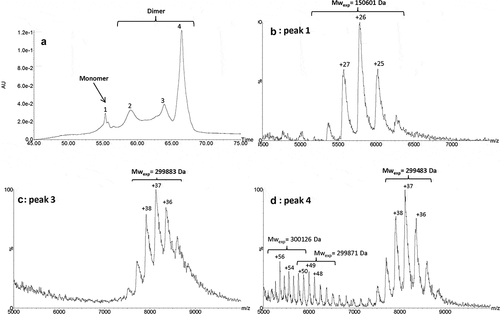
Figure 6. IEX-UV elution profile of the IdeS-digested HMW fraction (a) with insets representing native mass spectrum of peak 2. Native mass spectrum of peak 3 (b). IEX-UV elution profile of the IgdE-digested HMW fraction (c) with insets representing native mass spectrum of peak 2. Native mass spectrum of peak 3 (d). See conditions in Figure 5. Theoretical masses of F(ab’)2 dimer and Fab dimer are 199,411 Da and 99,076 Da, respectively.