Figures & data
Figure 1. Cell culture performance of clonal cell lines producing either the mAb2 or its in silico optimized variant in controlled fed-batch production processes. (a) Viable cell density (VCD, filled circles) and viability (open square), and (b) final antibody titer and (c) mean specific productivity (filled triangle) of the top eight clonal cell lines are shown for a controlled 14-day micro-bioreactor fed-batch cultivation process (ambrTM 15). In case of VCD and viability the mean and standard deviation of biological duplicates (n = 2) are displayed. Each replicate was used as single data point in the boxplot, and whiskers represent the 10th and the 90th percentile. The highlighted clones (thicker line and more intense color) were further investigated in 3 L benchtop bioreactors. An unpaired t-test confirmed statistical significance (****: p < .0001). (d) VCD (filled circles) and viability (open square), (e) cumulative antibody titer, and (f) calculated mean specific productivity of the best performing clonal cell lines in a controlled 14-day fed-batch cultivation process was performed in 3L bioreactors. The runs were performed without biological replicates, and antibody titer was determined starting from day 6. Clonal stability data can be found in Supplementary Figure S1.
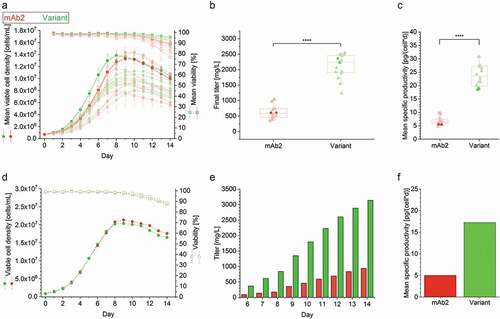
Figure 2. Investigation of CHO cells producing a good-to-express monoclonal antibody (GTE mAb) as reference, mAb2 and its in silico optimized variant. (a) Confocal images of cell lines producing the GTE mAb, mAb2 and the in silico optimized variant were acquired at a 63 x primary magnification. Additional information on productivity of the GTE mAb can be found in supplementary Figure S2. Nuclei and recombinant protein were stained using DAPI (blue) and a fluorescent secondary antibody (red). An overview can be found in supplementary Figure S3. (b) Ratio of single cells with intracellular antibody inclusions are shown for the total cell count. For visualization, cells have been cultured adherently for this analysis only. (c) The folding of free LC molecules (not bound to heavy chain) within the cell was analyzed densitometrically in three independent western blotting-electrophoretic mobility shift assays (supplementary Figure S5). An analysis of variance (ANOVA) determined statistical significance (*: p < .05; **: p < .01). M, Marker; ns, not significant.
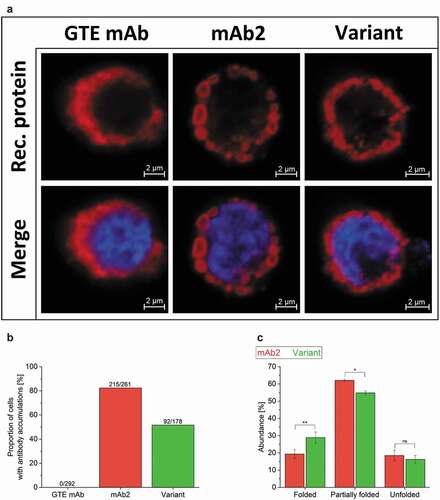
Figure 3. Characterization of the product quality after individual purification steps. (a–c) Low molecular weight – (LMW, A), high-molecular-weight species (HMW, C), and monomer (b) content of the drug substances of mAb2 and the in silico optimized variant were examined after individual purification steps by high-performance size-exclusion chromatography (HP-SEC). Acidic treatment, AT; depth filtration, DF; anion exchange chromatography, AEX; ultrafiltration/diafiltration, UF/DF; and initial drug product, initial DP. (d) The purity of the AEX-polished drug substance was determined by employing capillary electrophoresis on a Caliper. (e) The glycosylation profile of the drug substances was analyzed after protein A affinity chromatography (AC), DF and AEX by Caliper glycosylation analysis. G1 F* represents the second naturally existing glycan isomer of G1F. Man5, mannose-5; G, galactose; F, fucose.
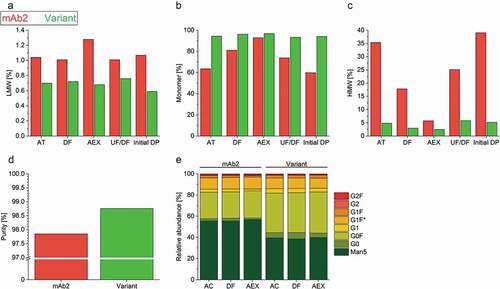
Figure 4. Thermal stability of the drug products. (a) Differential scanning calorimetry (DSC) and (b) Intrinsic fluorescence (IF) measurements indicated the thermal unfolding of mAb2 (red) and the in silico optimized variant (green). The change in (a) heat capacity and (b) first derivate of the fluorescence ratio indicate the Tm of the Fab.
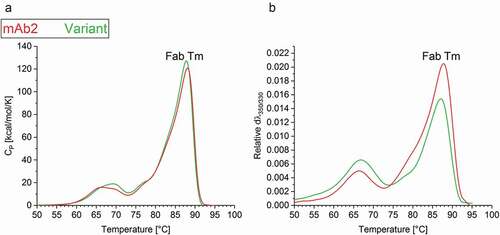
Figure 5. Colloidal stability of the drug products. (a) The aggregation temperature Tagg was determined simultaneously with the intrinsic fluorescence (IF) measurement by detection of dynamic light scattering (DLS). (b) DLS analysis unraveled an exponential increase of the mAb2 diameter within a protein concentration of 2–10 mg/ml, but a linear correlation in case of the in silico optimized variant.
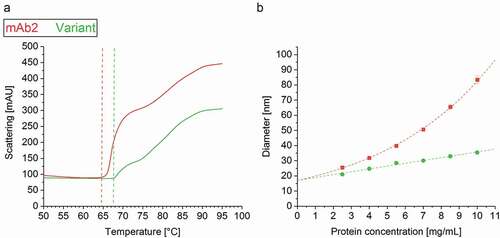
Figure 6. Product quality and colloidal stability of the drug products (DPs) during storage study. (a) Opalescence of the DPs and the formulation buffer was determined nephelometrically at a wavelength of 633 nm. * Initial mAb2 samples and samples stored at 2°C exceeded the calibrated range of the nephelometer (120 NTU). FB, Formulation buffer (25 mM Na-citrate, 125 mM NaCl, pH 6.0). (b) Particles with a size between ≥25 µm and <1000 µm of DPs and formulation buffer were quantified per ml using micro-flow imaging (MFI). (c) The proportion of high-molecular-weight (HMW) species in the DPs was examined by running high-performance size-exclusion chromatography (HP-SEC). (d) Samples were visually inspected concerning opalescence, color intensity and presence of particles. *Filamentous particles. (e) Example image of DPs and formulation buffer stored in glass vials for three month at 25°C.
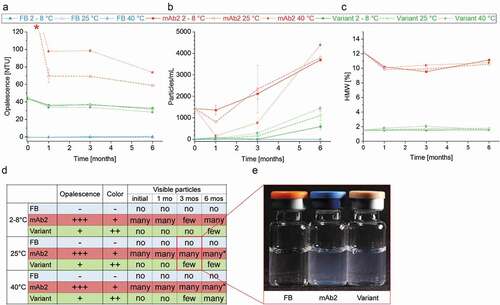
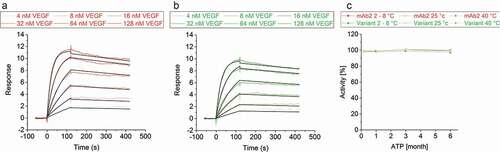
Table 1. Antibody-antigen binding kinetics: association and dissociation rate constants and equilibrium dissociation constant (KD).
Figure 7. Vascular endothelial growth factor binding activity of mAb2 and its in silico optimized variant. Binding kinetics of a concentration series of vascular endothelial growth factor (4, 8, 16, 32, 64 and 128 nM) to immobilized (a) mAb2 and (b) the in silico optimized variant was measured. Double-referenced curves were fitted to a 1:1 binding model (black line). (c) Binding of the initial drug product (DP) of mAb2 to vascular endothelial growth factor was measured by SPR, and the response was set to 100%. The activity of all other samples was compared in percentage difference to that of the initial mAb2 DP. SEC indicated that aggregates of mAb2 are resolved in SPR buffer (data not shown).