Figures & data
Figure 1. Elucidation of the central dogma and typical error rate in each step.
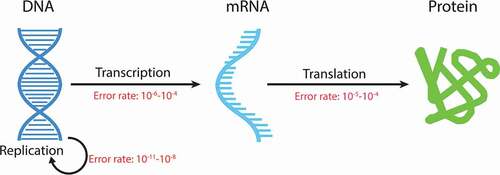
Table 1. Summary of the reported SV levels in natural and recombinant proteins under three scenarios.
Table 2. Approved therapeutic proteins selected for the SV benchmark survey
Table 3. Comparison of SV identification and quantification across three testing laboratories.
Figure 2. Comparison of the SV identification across three testing laboratories.
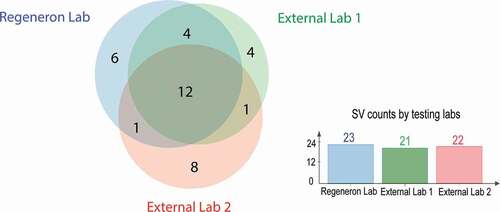
Figure 3. (a) The level of SVs and type of amino acid substitutions identified across 15 therapeutic proteins and NIST mAb. All the SVs above 0.1% are labeled with the substitution locations, all in EU numbering. For these occurring to the CDR regions, the SVs are labeled with the CDR number instead of the specific sequence location. (b) The level of SVs and type of amino acid substitutions identified across 14 therapeutic proteins and NIST mAb with the exclusion of mAb-16.
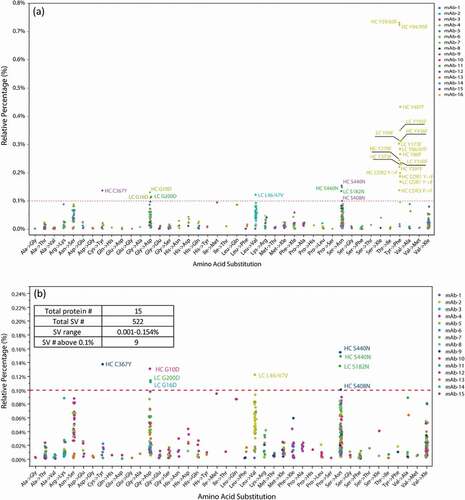
Figure 4. SV distribution boxplot across all the identified amino acid substitution type measured from 14 therapeutic proteins and NIST mAb. The SVs that are above the 0.1% limit can be considered as outliers of the distribution.
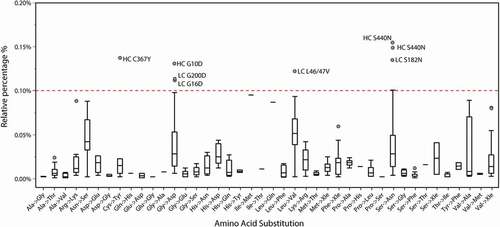
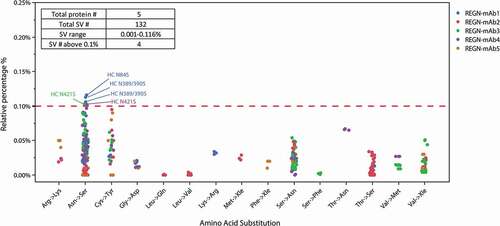
Figure 5. The level of SVs and type of amino acid substitutions identified across 5 REGN antibodies under developments. All the SVs above the 0.1% limit are labeled with the substitution locations, all in EU numbering.