Figures & data
Table 1. Overview of investigated mAb producer cell lines.
Figure 1. Loss of antibody glycosylation induced by the antagonistic autocrine effect of the produced antibody and virus replication. Growth inhibitory effect of nivolumab (a) or trastuzumab (b) on non-HER2 expressing (A549 and Detroit 551) and HER2-positive (MCF7, SKBR3 and BT474) cells, normalized to untreated cells. SKBR3 and BT474 cells showed a significant decrease in cell viability upon trastuzumab addition (continuous lines), while the cell viability of the remaining cell lines was not influenced by trastuzumab (dotted lines). c) Quantification of non-glycosylated antibody species of nivolumab (white bars) or trastuzumab (red bars) by peptide mass analysis. Only trastuzumab-responsive BT474 and SKBR3 cells produced elevated levels of non-glycosylated or half-glycosylated antibody species. The cell viability of A549 (d) or HEK293 (e) cells treated with a nivolumab-encoding first-generation (filled circles) or gutless adenoviral vector (empty circles) normalized to untreated cells. f) Non-glycosylated antibody forms could only be observed under conditions promoting viral replication (i.e., from the first-generation virus in HEK293 cells). Cell viability was obtained from three separate cell populations. Peptide mass spectrometry data represent three individual consecutive measurements. Error bars represent SEM. Data comparison was done with a two-way ANOVA test, p > 0.01 (**) and p < 0.0001 (****) are indicated.
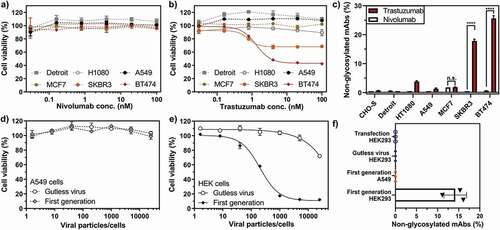
Figure 2. Optimization of homogeneous production of nivolumab. a) Construct used for expression. The heavy and light chain (dark and light blue) of the expressed antibodies are expressed under the control of a CMV promotor with a 2A site to facilitate equimolar expression. The heavy and light chain are getting separated by a ribosomal skipping mechanism initiated by a 2A site (black). In order to remove residual 2A site residues at the C-terminus of the heavy chain, a furin site (yellow) was encoded upstream of the 2A site. Cleavage sites are depicted in the protein sequence by black arrows. Following cleavage, the signal sequence is translocated and processed, and the residual basic residues of the furin site removed by carboxypeptidases, resulting in unmodified heavy and light chain molecules. The full antibody sequence of trastuzumab and nivolumab are shown in Sup. Fig. 1 and 2. Three 2A sites (F2A, P2A and T2A) were tested to achieve homogenous antibody backbone masses. b) Mass analysis of the PNGase F deglycosylated antibodies. Nearly complete processing of nivolumab is revealed for the P2A construct, as evidenced by the identical mass as observed for the commercial Opdivo. In contrast, the T2A construct shows the presence of minor antibody species with incomplete carboxypeptidase cleavage. In all cases, some low abundant species were detected, representing the clipping of glycine from the C-terminus of the heavy chain. The glycosylation state is shown of nivolumab (c) or trastuzumab (d) expressed from CHO-S cells, transfected with naked DNA or infected with a replication-deficient adenoviral vector. Very similar glycosylation patterns are observed by quantitative glycopeptide analyses. Peptide mass spectrometry data represent three individual consecutive measurements (n = 3).
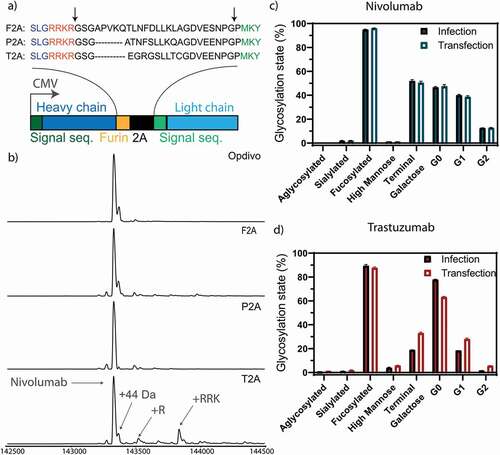
Figure 3. Non-glycosylated trastuzumab is exclusively produced from HER2-addicted cells. Zero-charge deconvoluted native mass spectra of the intact trastuzumab (a) and nivolumab (b) produced from Detroit and BT474 cell lines. The spectra are separated into three sections, highlighting the mass range of non-glycosylated (red), half-glycosylated (blue), and fully glycosylated forms (gray). c) Trastuzumab expressed from HER2-addicted cells (BT474 and SKBR3) led to the production of a substantial amount of non-glycosylated or half-glycosylated antibodies, while trastuzumab expressed from non-HER2 addicted cells resulted in only fully glycosylated antibodies. d) As a control, nivolumab showed neither non- nor half-glycosylated variants regardless of HER2 addiction of the producer cell line.
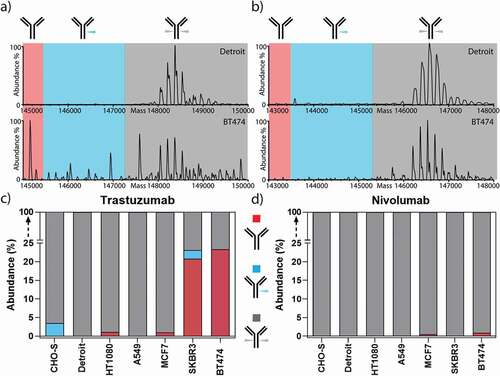
Figure 4. Glycosylation profile of trastuzumab expressed in a representative set of cell lines. Quantitative comparison of glycosylation patterns based on mass spectrometric analysis of tryptic glycopeptides derived from trastuzumab produced by CHO-S, fibroblast (Detroit 551), and two cancer cell lines (A549 and SKBR3). Overall differences in the antibody glycosylation are expressed in bar charts showing a comparison of three functionally relevant glycan types among different cell lines. Changes in the microheterogeneity are shown by the different coloring of the segments in the stacked columns, representing different glycan compositions, and by depicting some of the most abundant glycans next to the corresponding segment. Of note, some glycoforms appear in both fucosylated and sialylated classes, as they contain both sialic acid and fucose. Antibodies expressed from tumor cells showed substantial differences in microheterogeneity in comparison to antibody glycosylation from non-cancer cells, represented by the table under the chart summarizing the number of glycoforms found for each cell line. Peptide mass spectrometry data represent three individual consecutive measurements.
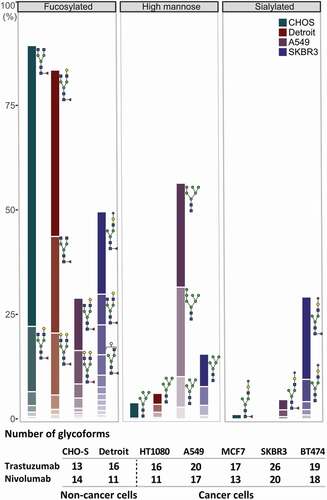
Figure 5. Key glycosylation characteristics of cancer cell-produced antibodies. Antibody glycosylation was quantified by MS analysis of tryptic digests derived from corresponding IgG products. a) Exclusively cancer cells produced antibodies with elevated levels of sialylation. b) The α2-6 sialic acid transferase ST6GAL1 was elevated in cancer cell lines as detected by Western blot, whereas no ST6GAL1 was detected in non-cancer cell lines. c) While the amount of fucosylated nivolumab was consistently high in all cell lines, fucosylation was substantially reduced for trastuzumab produced in several cancer cell lines, independent of HER2 expression. d) Expressed antibodies consist of a mixture of different glycoforms, i.e., strongly ADCC-promoting, with a non-fucosylated glycan (green), weakly ADCC-promoting, fucosylated (gray) or ADCC-impaired, non-glycosylated (red) antibodies. e) A FcγRIIIa-activation assay was used to elucidate the potential effect of cancer cell expressed antibodies on their ADCC response. Trastuzumab binding to HER2-positive cells (SKBR3) leads to the induction of luciferase in a Jurkat detection cell line upon FcγRIIIa-activation. f) FcγRIIIa-activation of trastuzumab expressed from different cell lines as compared to Herceptin is shown. Opdivo, which is a non-HER2 binding IgG4, functions as a negative control, as this isotype has impaired FcγRIIIa binding. FcγRIIIa activation data was obtained from three separate cell populations. Peptide mass spectrometry data represent three individual consecutive measurements. Error bars represent SEM. Data comparison was done with a two-way ANOVA test, p < 0.01 (**) and p < 0.0001 (****) are indicated.
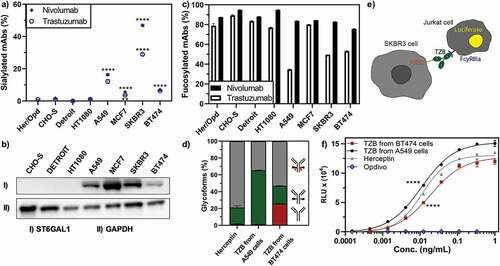
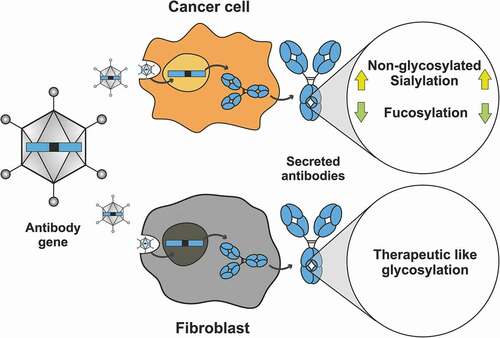
Figure 6. Summary: Expression in different host cells influences antibody glycosylation, potentially enhancing activity. Here we expressed two clinically approved antibodies (trastuzumab and nivolumab) in various cancer and non-cancerous cell lines upon gene delivery by a viral vector. The cancer cell lines induced specific glycosylation patterns different from the commercially produced therapeutic antibody, whereas the fibroblast cell line showed more therapeutic-like glycosylation with regards to sialyation and fucosylation. Hypersialylation, as reported to occur on surface receptors of cancer cell lines, is also reflected by the antibodies that are secreted from these cells, and can be linked to the enhanced expression of the sialic acid transferase ST6GAL1 in the tested cancer cell lines. Several cancer cell lines produced and secreted IgGs harboring substantially less fucosylation, which we showed can lead to improved FcγRIIIa binding and thus increased ADCC. Cancer cells sensitive to the antibody they secrete do often respond by the production of non-glycosylated antibody molecules. Thus, when antibodies are produced in vivo, they have to be targeted by viral vectors to the optimal producer cells, which has now become possible. Furthermore, such strategies could further benefit from glycoform engineering, potentially further increasing their therapeutic efficacy.