Figures & data
Table 1. Kinetics for RTX, OBI and OFA binding traces from , and according to Interaction Map analysis.
Figure 1. (a) FITC-labeled RTX binding to Daudi cells with two increasing concentrations of 20 and 60 nM during the association phase, dissociation was measured in plain medium. (red, n = 4) Data was fitted to a 1:1 binding model (black). (b) Interaction Map analysis for RTX binding to Daudi cells, input data from all four binding curves in (a) was used for the calculation. The analysis results in two defined interaction components that mainly differ in their binding stability (x-axis). The more stable component is dominating with the tested RTX concentrations, indicated by warmer colors in the plot. (c) Daudi cells were incubated with 9 nM FITC-labeled RTX and binding recorded (black). After 10, 30, 60 and 90 min, 9 nM of RTX labeled with a quencher was added to the incubation solution (red). Gaps in the binding curves indicate the time point when the incubation solution was changed to cell culture medium not containing any RTX. All displayed curves were normalized in signal height by setting the baseline to 0% and the signal at the timpoint of the first quencher addition (10 min) to 100%. Target occupancy was calculated using the Bmax value obtained from fitting a 1:1 model to the black curve, containing only 9 nM FITC-RTX.
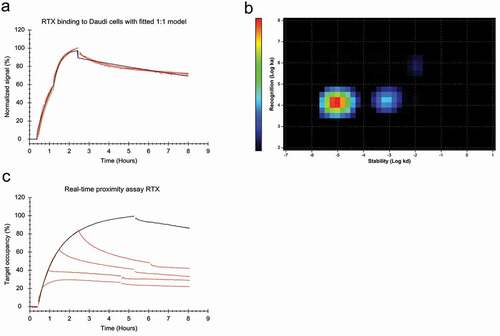
Table 2. Affinity values according to IM analysis for RTX, OBI and OFA at highest and lowest tested concentration in the presence of equimolar amount of unlabeled antibody during the dissociation.
Figure 2. (a) Daudi cells were incubated with FITC-RTX in the concentration range from 7 to 60 nM until binding levels are close to equilibrium followed by replacement with the same concentration of unlabeled RTX to observe the release of bound FITC-RTX. (b) Interaction Map analysis for the binding traces displayed in (a). With increasing concentrations, the interaction shifts to the right on the x-axis, indicating that RTX binding becomes less stable with increasing concentrations.
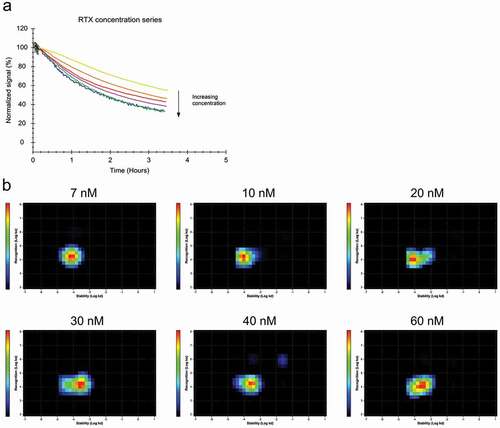
Table 3. Kinetics for Fab fragments of RTX, OBI and OFA extracted with a 1:1 binding model.
Figure 3. (a) Binding of 10 nM and 60 nM FITC-labeled RTX-Fab to Daudi cells in the presence (red) and absence (blue) of 10 nM and 60 nM unlabeled RTX-Fab during dissociation, respectively. (b) Interaction Map analysis for 60 nM FITC-RTX-Fab binding to Daudi cells (c) Binding of 60 nM full-length RTX (green) and RTX-Fab2 (gray) to Daudi cells. Dissociation was recorded in plain cell culture medium for both. (d) The binding stability in the presence of ligand in solution was tested for the following association + dissociation combinations: FITC-RTX-IgG + unlabeled RTX-F(ab’)2 (gray), FITC-RTX-IgG + unlabeled RTX-IgG (green), FITC-RTX-F(ab’)2 + unlabeled RTX-IgG (pink) and for FITC-RTX-F(ab’)2 + unlabeled RTX-F(ab’)2(blue). (e) The percentage of molecules bound more stably as estimated by globally fitting a 1:2 model to the data displayed in (d).
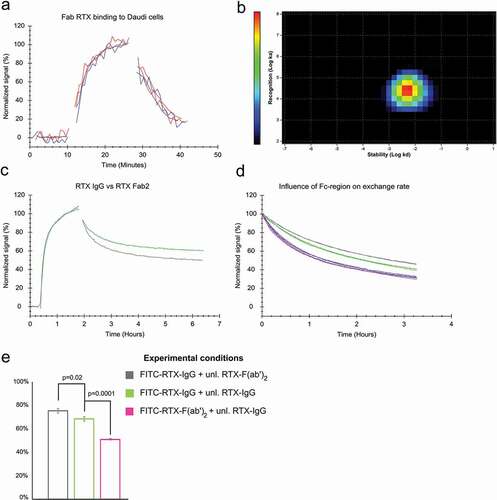
Figure 4. (a) FITC-labeled OBI binding to Daudi cells with two increasing concentrations of 5 and 15 nM during the association phase, dissociation was measured in plain medium. (n = 4) (b) InteractionMap analysis for OBI binding to Daudi cells, input data from all four binding curves in (a) was used for the calculation. The analysis results in two defined interaction components that mainly differ in their binding stability (x-axis). The more stable component is contributing more to the overall interaction pattern, as indicated by warmer colors in the plot. However, the difference in contribution is less between the two components than for RTX (compare to ). (c) Daudi cells were incubated with FITC-OBI in the concentration range from 5 to 60 nM until binding levels are close to equilibrium followed by replacement with the same concentration of unlabeled OBI to observe the release of bound FITC-OBI. (d) Binding of 60 nM FITC-labeled OBI-Fab to Daudi cells in the presence (red) and absence (blue) of 60 nM unlabeled OBI-Fab. (e) Interaction Map analysis for the binding traces displayed in (c). With increasing concentration the main interaction component shifts to the right on the x-axis, indicating that OBI binding becomes overall less stable with increasing concentrations. From 7 nM on, a second interaction component becomes visible with separates completely from the main interaction at 10 nM. This secondary interaction component is more stable and does not change with further concentration increase, but has a minor contribution to the overall interactions, as indicated by the color scale.
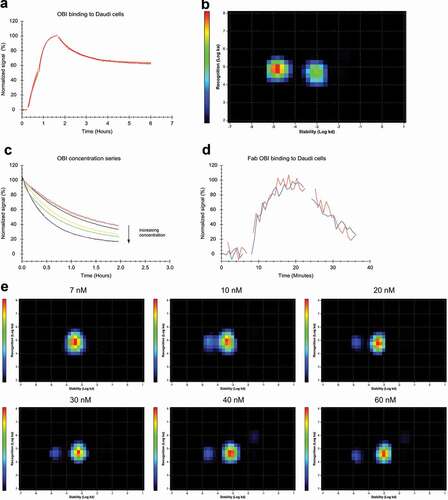
Figure 5. (a) FITC-labeled OFA binding to Daudi cells with two increasing concentrations of 12 and 36 nM during the association phase, dissociation was measured in plain medium. (n = 3) (b) InteractionMap analysis for OFA binding to Daudi cells, input data from all three binding curves in (a) was used for the calculation. The analysis results in one main interaction component with a second component only very faintly visible, barely contributing to the overall binding pattern. (c) Different concentrations of FITC-OFA were incubated on Daudi cells, close to binding equilibrium the solution was replaced with cell media containing the same amount of unlabeled OFA to observe the stability of bound OFA in the presence of free OFA in solution. (d) Binding of 10 nM (traces with longer incubation times) and 60 nM FITC-labeled OFA-Fab to Daudi cells in the presence (red) and absence (blue) of 10 nM and 60 nM unlabeled OFA-Fab, respectively. (e) Interaction Map analysis for the binding traces displayed in (c). With increasing concentration, the main interaction component spreads in y-axis direction implying that the interaction cannot be described with a single ka-value at higher concentrations. At concentrations of 40 nM and above a faintly visible second interaction component appears that is less stable compared to the main interaction component and contributes little to the overall binding pattern.
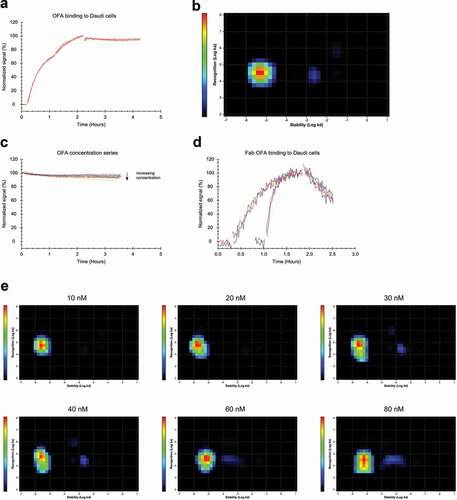
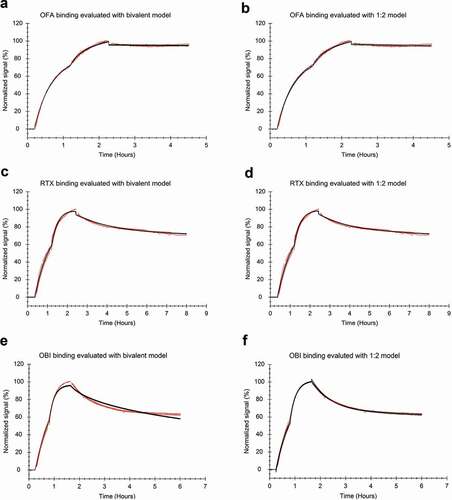
Table 4. Kinetics for RTX, OBI and OFA binding traces from , and as extracted with a 1:2 binding model.
Figure 6. Antibody binding to Daudi cells with two increasing concentrations and a dissociation measured in plain medium (red) evaluated by applying a global fit (black) (a, b) FITC-labeled OFA at 12 and 36 nM during the association phase (n = 3) fitted to the bivalent model (a) or the 1:2 model (b). (c, d) FITC-labeled RTX at 20 and 60 nM during the association phase (n = 4) fitted to the bivalent model (c) or the 1:2 model (d). (e, f) FITC-labeled OBI at 12 and 36 nM during the association phase (n = 3), fitted to the bivalent model (e) or the 1:2 model (f).