Figures & data
Figure 1. Schematic illustration of mAb-peptide homodimeric conjugate 2. mAb HC shown in green, LC in blue. OXM peptide shown as gray circles. The variable and constant regions of the mAb are labeled. For monomeric conjugate 1, one of the OXM peptides was replaced by acetamide.
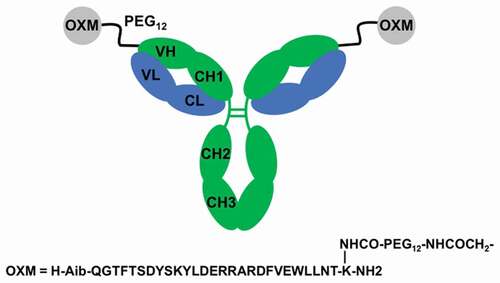
Table 1. Pharmacokinetic parameters of 2 in DIO mice, Tg32 mice, SD rats, and cynomolgus monkeys. Exposures were measured by LCMS determination of intact mass. Mouse values were calculated from pooled samples.
Figure 2. Ex vivo human plasma stability of 2 over 1 week (filled circles). Percentage remaining is measured by functional assay at recombinant GLP1 receptors. The negative control (open circles) is a bioconjugate of a different oxyntomodulin variant known to be unstable in human plasma.
Figure 3. Pharmacokinetics of 2 in lean cynomolgus monkeys over 10 days. Exposures are shown for intravenous (IV) and subcutaneous (SC) administration. Exposures were measured by LCMS determination of intact mass.
Table 2. In vitro potencies, mean ± SEM, of 1, 2 and native oxyntomodulin (OXM) on cells expressing (a) GLP-1R and (b) GCGR of various species.
Table 3. Inhibition constants, mean ± SEM, of 1, 2 and GLP1 vs radiolabeled GLP1. Human GLP-1R membranes were incubated with 0.3 nM Citation1Citation25I-GLP1.
Figure 4. Single dose effects of 2 on (a) glucose excursions and (b) net AUC in insulin-resistant DIO mice. Groups were compared using One-way ANOVA, followed by Tukey’s multiple comparison post-hoc test (*p < .05, versus Vehicle).
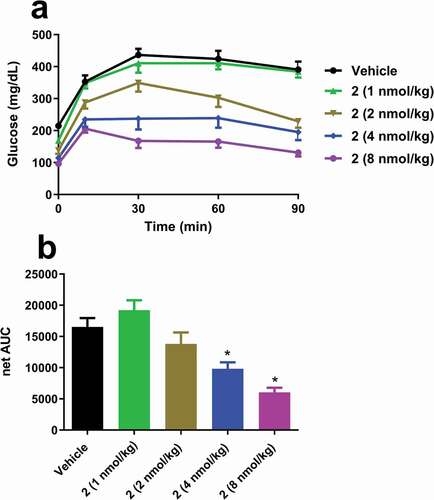
Figure 5. Repeat dosing effects of 2 on (a) food intake and (b) weight change in DIO mice over 9 days. Weight change was measured in pair-fed animals where the food intake between the dosed and non-dosed arms is matched. For (a), groups were compared using Linear mixed model, followed by Tukey’s multiple comparison post-hoc test (*p < .05, Vehicle versus 4 nmol/kg; ^p < .05, Vehicle versus 1 & 2 nmol/kg; #p < .05, 4 nmol/kg versus 1 & 2 nmol/kg). For (b), groups were compared using Two-way ANOVA repeated measures, followed by Tukey’s multiple comparison post-hoc test (*p < .05, Vehicle versus all groups; ^p < .05, between all groups treated with 2; #p < .05, between all groups treated with 2 and their respective PF [pair-fed] groups).
![Figure 5. Repeat dosing effects of 2 on (a) food intake and (b) weight change in DIO mice over 9 days. Weight change was measured in pair-fed animals where the food intake between the dosed and non-dosed arms is matched. For (a), groups were compared using Linear mixed model, followed by Tukey’s multiple comparison post-hoc test (*p < .05, Vehicle versus 4 nmol/kg; ^p < .05, Vehicle versus 1 & 2 nmol/kg; #p < .05, 4 nmol/kg versus 1 & 2 nmol/kg). For (b), groups were compared using Two-way ANOVA repeated measures, followed by Tukey’s multiple comparison post-hoc test (*p < .05, Vehicle versus all groups; ^p < .05, between all groups treated with 2; #p < .05, between all groups treated with 2 and their respective PF [pair-fed] groups).](/cms/asset/1dabc326-2dfd-4c0a-a9f4-bece75ab89f6/kmab_a_1794687_f0005_oc.jpg)
Figure 6. (a) Single dose terminal exposures of 1 and 2 in DIO mice. Exposures were measured by LCMS of the intact conjugates. (b) Effects of a single dose of 1 and 2 on body weight. (c) Effects of a single dose of 1 and 2 on plasma FGF21. For (a), groups were compared using One-way ANOVA, followed by Tukey’s multiple comparison post-hoc test (*p < .05, 2 [10 nmol/kg] versus 1 & 2 [3 nmol/kg]; ^p < .05, 1 [10 nmol/kg] versus 2 [10 nmol/kg]). For (b), groups were compared using Two-way ANOVA repeated measures, followed by Tukey’s multiple comparison post-hoc test (*p < .05, Vehicle versus all groups; ^p < .05, 2 [3 nmol/kg] versus 1 [3 nmol/kg]; #p < .05, 1 & 2 [3 nmol/kg] versus 1 & 2 [10 nmol/kg]; $p < .05, Vehicle versus all groups except 1 [3 nmol/kg]; @p < .05, 1 [10 nmol/kg] versus 2 [3 & 10 nmol/kg]). For (c), groups were compared using One-way ANOVA, followed by Tukey’s multiple comparison post-hoc test (*p < .05, Vehicle versus all groups except 1 [3 nmol/kg]; ^p < .05, 2 [3 nmol/kg] versus 2 [10 nmol/kg] & 1 [3 nmol/kg]; #p < .05, 1 [10 nmol/kg] versus 1 [3 nmol/kg]).
![Figure 6. (a) Single dose terminal exposures of 1 and 2 in DIO mice. Exposures were measured by LCMS of the intact conjugates. (b) Effects of a single dose of 1 and 2 on body weight. (c) Effects of a single dose of 1 and 2 on plasma FGF21. For (a), groups were compared using One-way ANOVA, followed by Tukey’s multiple comparison post-hoc test (*p < .05, 2 [10 nmol/kg] versus 1 & 2 [3 nmol/kg]; ^p < .05, 1 [10 nmol/kg] versus 2 [10 nmol/kg]). For (b), groups were compared using Two-way ANOVA repeated measures, followed by Tukey’s multiple comparison post-hoc test (*p < .05, Vehicle versus all groups; ^p < .05, 2 [3 nmol/kg] versus 1 [3 nmol/kg]; #p < .05, 1 & 2 [3 nmol/kg] versus 1 & 2 [10 nmol/kg]; $p < .05, Vehicle versus all groups except 1 [3 nmol/kg]; @p < .05, 1 [10 nmol/kg] versus 2 [3 & 10 nmol/kg]). For (c), groups were compared using One-way ANOVA, followed by Tukey’s multiple comparison post-hoc test (*p < .05, Vehicle versus all groups except 1 [3 nmol/kg]; ^p < .05, 2 [3 nmol/kg] versus 2 [10 nmol/kg] & 1 [3 nmol/kg]; #p < .05, 1 [10 nmol/kg] versus 1 [3 nmol/kg]).](/cms/asset/b7c71c15-fb77-446d-9474-06cc512bdf7d/kmab_a_1794687_f0006_oc.jpg)
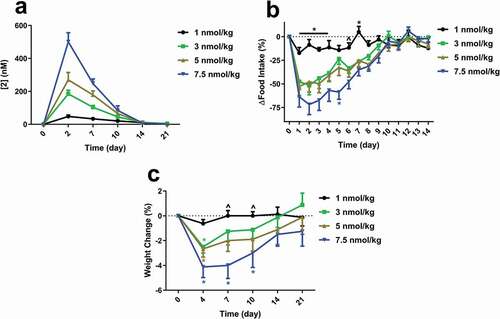
Figure 7. (a) Single dose exposures of 2 in overweight cynomolgus monkeys. Exposures were measured by LCMS of the intact conjugate. Effects of a single dose of 2 on (b) food intake and (c) weight change. Animals were dosed subcutaneously at day 0. For (b), groups were compared using Two-way ANOVA repeated measures, followed by Tukey’s multiple comparison post-hoc test (*p < .05, 1 nmol/kg versus all other doses; ^p < .05, 1 nmol/kg versus 5 & 7.5 nmol/kg). For (c), groups were compared using Two-way ANOVA repeated measures, followed by Tukey’s multiple comparison post-hoc test (*p < .05, versus respective baseline).