Figures & data
Figure 1. CD20 antibodies bind similarly to CD20. Antibody-binding to Ramos cells analyzed by flow cytometry. Graphs show binding for IgG1, IgA1 and IgA2 for each different variable region antibody at several antibody concentrations. One representative graph is shown for at least n = 3 independent experiments.
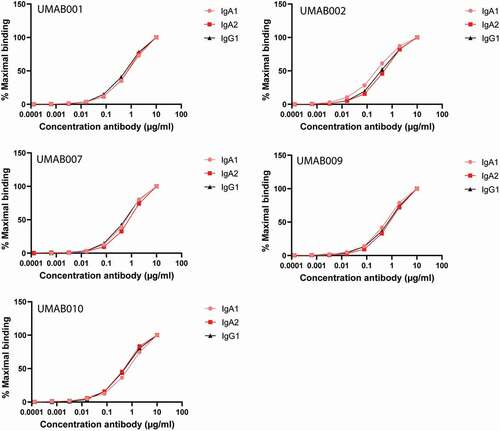
Figure 2. ADCC by a panel of CD20 antibodies of the IgA1, IgA2 and IgG1 isotype. (a) PMN-mediated ADCC against Ramos cells by IgA CD20 antibodies at several antibody concentrations. After 4 h at 37°C,51-Cr-release was measured to assess specific lysis. PMN were added to tumor cells at an ET ratio of 40:1. One representative graph is shown for at least n = 3 independent experiments. (b) Maximal lysis achieved by antibodies in A. Asterisks indicate statistically significant differences between IgG1 and IgA antibodies. Capped lines with asterisks indicate a statistically significant difference between IgA1 and IgA2 antibodies. (c) ADCC assays against healthy B cells with autologous PMN as effector cells. Antibodies were added to tumor cells at 5 µg/ml. PMN were added to tumor cells at an ET ratio of 40:1. After 4 h at 37°C,51-Cr-release was measured to assess specific lysis. Results of two different donors are shown (left and right panel). Asterisks indicate a significant difference to the no Ab control. (d) B-CLL ADCC assays with allogenic PMN as effector cells. Results of two different PMN donors are shown (left and right panel). After 4 h at 37°C,51-Cr-release was measured to assess specific lysis. Antibodies were added to tumor cells at 4 µg/ml. PMN were added at an E:T ratio of 40:1. Asterisks indicate statistically significant differences to the no Ab control.
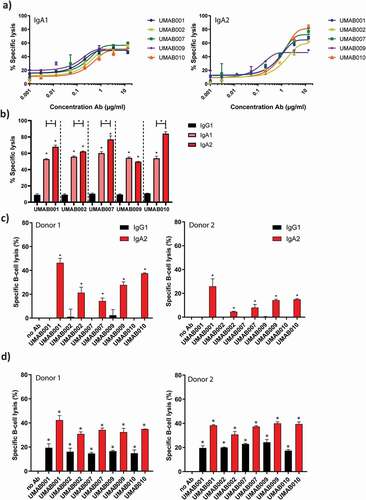
Figure 3. CD24 is a stable marker for B cell depletion and indicates B-cell depletion more closely than CD19. WBLs were incubated for 4 h at 37°C in the presence of CD20 antibodies. The level of B-cell depletion was analyzed by flow cytometry. (a) Apparent loss of B cells mediated by IgA1, IgA2 and IgG1 CD20 antibodies. (b) Effect of increasing antibody concentration (IgA1 UMAB001) on CD19 levels. (c) Quantification of CD19 expression at several antibody concentrations, gated on CD24 + B cells (d) Quantification of CD24 expression on initially CD19 positive B cells. (e) Quantification of remaining B cells after whole blood leukocyte-mediated B cell depletion assay with CD20 antibodies gating on CD24 + B cells. One representative graph is shown for at least n = 3 independent experiments. Asterisks indicate statistically significant differences compared to the no Ab control.
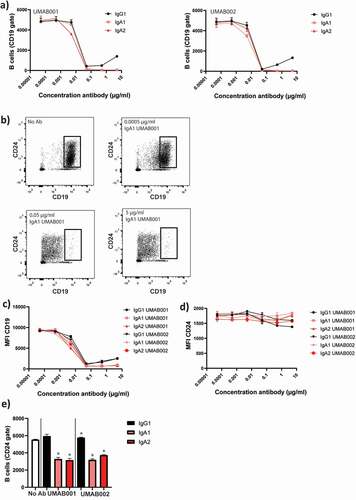
Figure 4. Apoptosis induction by CD20 antibodies. Apoptosis induction on Ramos cells by CD20 antibodies at 10 µg/ml. After 6 h of incubation time at 37°C, cells were stained with (a) lysotracker red or (b) DioC6 and analyzed by flow cytometry. Results are shown of a single experiment.
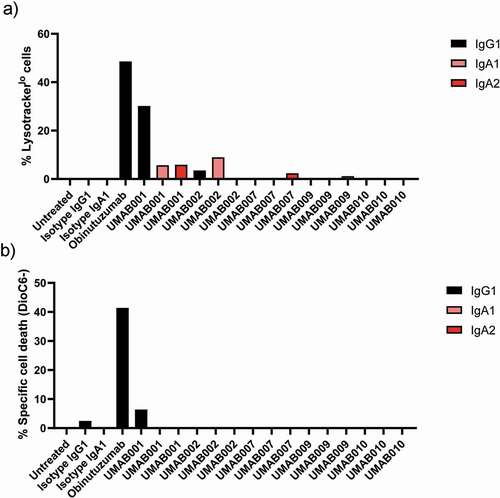
Figure 5. IgA antibodies activate the complement system via the classical pathway. (a) FACS-based CDC assay against Ramos cells by isotype variants of CD20 UMAB002 antibodies at 10 µg/ml at indicated timepoints at 37°C. (b) FACS-based CDC assay against Ramos cells by IgA CD20 antibodies at 10 µg/ml for 4 h at 37°C. Asterisks indicate a significant difference with IgG antibodies with the same variable region. (c) CDC assay against Ramos cells by IgA CD20 antibodies at 10 µg/ml in presence or absence of C1q for 4 h at 37°C. One representative graph is shown for at least n = 3 independent experiments.
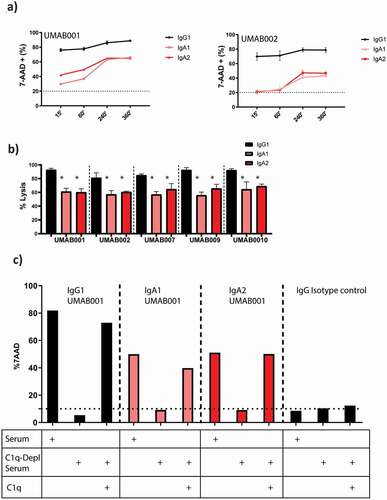
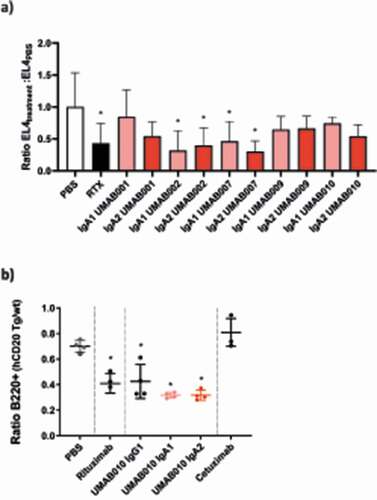
Figure 6. In vivo efficacy of CD20 antibodies. (a) EL4-CD20 intraperitoneal model. CD89 Tg and NTg C57bl/6 j mice were injected IP with EL4-CD20 cells and 16 h later were treated with 100 µg of CD20 antibodies or phosphate-buffered saline (PBS). After 24 h, the number of tumor cells in the peritoneal wash was determined by flow cytometry via TrueCount tubes (4–12 mice per group, data of two pooled independent experiments are shown). Asterisks indicate a statistically significant difference compared to the PBS-treated group. (b) CD89 Tg and NTg C57bl/6 j mice were i.v. injected with huCD20+ and CD20- murine splenocytes labeled with a with either a high or low concentration of CellTrace Violet. After 24 h, mice were injected intravenously with 37.5 µg of IgG1 or 150 µg of IgA antibodies to correct for differences in half-life. After 16 h, spleens were isolated and the ratio of huCD20+ and huCD20- murine B220+ splenocytes was determined by flow cytometric analysis. Asterisks indicate statistically significant differences compared to the PBS-treated group.