Figures & data
Figure 1. HRF structural analysis of the IgG1-FcRn complex. Oxidative footprint of the tryptic peptides from IgG (a) and FcRn (b) in the free and bound states. (c) The model structure of IgG-FcRn complex. The region color-highlighted in the structure corresponding to the color in the bar graph. **P < .01.
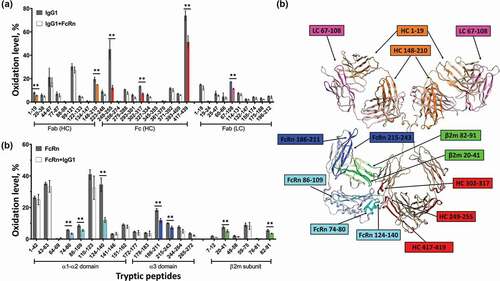
Figure 2. Visualization of IgG1-FcRn complex by negative stain electron microscopy. Six representative classifications of IgG1 and IgG1-FcRn complex are shown. FcRn is highlighted with yellow arrows/circles. (a) IgG1 alone in a canonical Y-shaped conformation. (b) IgG1 in a T-shaped conformation and binds to FcRn at 1:1 stoichiometry. (c) IgG1 in a Y/T mixed conformation and binds to FcRn at 1:1 stoichiometry. (d) IgG1 in a canonical Y-shaped conformation and binds to FcRn at 1:1 stoichiometry. (e) IgG1 in a T-shaped conformation and binds to FcRn at 1:2 stoichiometry. (f) IgG1 in a Y/T mixed conformation and binds to FcRn at 1:2 stoichiometry.
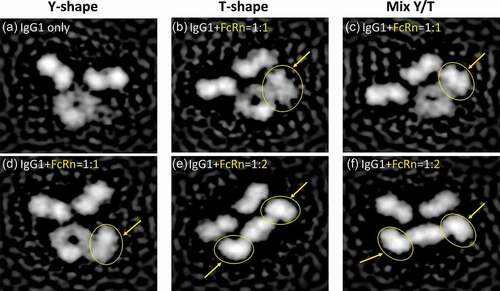
Figure 3. Structural changes of IgG1 induced by antigen binding. Bar graph one the left shows the oxidative labeling footprint of the tryptic peptides from IgG1 light chain (upper panel) and heavy chain (lower panel) in the free and antigen-bound states. The model structure of IgG1 antibody is shown on right. The region color-highlighted in the structure corresponding to the color in the bar graph. *P < .05, **P < .01.
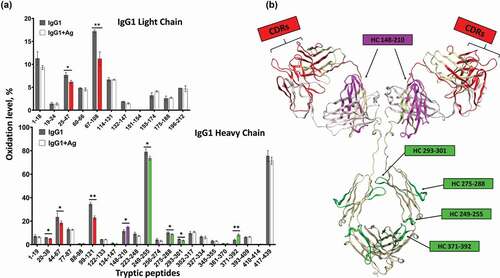
Table 1. FcRn affinity to Ag-IgG1 complexes.
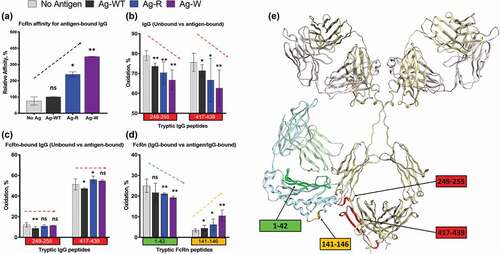
Figure 4. Structural changes in IgG1-FcRn complex induced by different antigens. (a) SPR analysis. The relative affinity of IC-FcRn as compared to Ag-WT/IgG1/FcRn (100%). (b-d) HRF analysis. Oxidative labeling footprint of two tryptic peptides from IgG1 Fc region in the FcRn-free antigen-bound forms (b), and FcRn-bound antigen-bound forms. (c). Oxidative labeling footprint of two tryptic peptides from FcRn in Ag-bound forms. (e) The model structure of IgG1-FcRn. The region color-highlighted in the structure corresponding to the color in the bar graph. *denotes significant difference relative to no Ag. ns: not significant, *p < .05, **p < .01.