Figures & data
Table 1. Characteristics of the three unique target sites on SERINC5, as predicted by OptimunAntigenTM. The human SERINC5 isoform 1 amino acid numbers and sequence is available at the GenPet NCBI reference sequence NP_001167543.
Figure 1. BALB/c mouse immunization scheme. At weeks 0, 3, 15 mice were immunized using a Gene gun with 3 ug codon-optimized S5.1 DNA in water-soluble adjuvant. At weeks 6, 9, 15 mice received 50 ug intraperitoneal injections of KLH-conjugated peptide in IFA or CFA. Peptide conjugated to KLH without adjuvant was given at 22 weeks plus 4–5 days, before the final sacrifice for splenic fusion. Blood draws (red droplets) were at baseline or two weeks post-immunizations, at week (w) 0, 5, 8, 11 and 17.
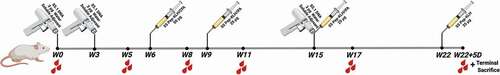
Figure 2. Mouse serum IgG ELISA titers at 2 weeks after each SERINC5 peptide boost. Serum IgG binding titers to the respective immunizing SERINC5 peptides were evaluated for each animal two weeks after the 3rd (W8, red lines), 4th (W11, green lines), and 5th (W17, black lines) immunizations. The group means after each peptide immunization (with a standard error of the mean) are shown (a–c). Responses of individual mice for each group are shown for W11 (d–f) and W17 (g–i).
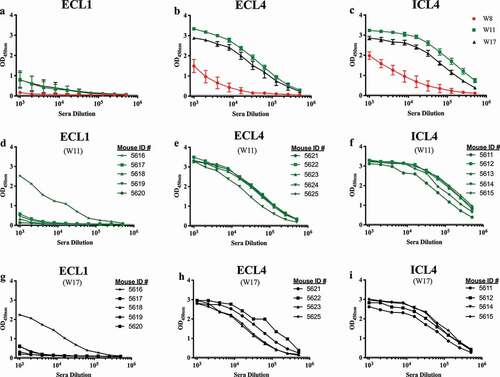
Figure 3. Hybridoma clone screening post fusion by whole cell ELISA (WCE) using the HEK293_S5.1 cell line. The input IgG concentrations for supernatants from each peptide group were normalized to the lowest sample IgG for comparisons of titer; the assay cutoff is indicated by the dotted lines.
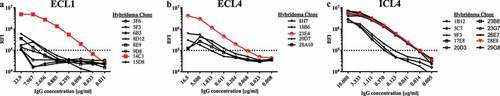
Table 2. Antibody performance in multiple applications using the four down-selected and purified SERINC5 monoclonal antibodies. The first + or – symbol indicates mAb performance using the HEK293_S5.1 cell line as an antigen source for SERINC5, and the second symbol (following the/) indicates the activity of the mAb on any of the other five cell lines tested. ND indicates not done, for the respective antibody and assay.
Figure 4. Detection of SERINC5 in HEK293 cells transduced to overexpress SERINC5 isoform 1 (HEK293_S5.1). (a) HEK293_S5.1 cell extract was applied to two preparative wells of a 12% polyacrylamide gel, with a center lane containing labeled molecular weight standards. The MPX blotting system was applied to the blot to screen for mAb reactivity with (lanes 6–10) or without (lanes 1–5) competition with the matched immunizing peptides at 10 μg/mL. The mAbs were added at 0.5 μg/mL to lanes in the MPX as follows: 14C1-1 (1 and 6); 18B6-1 (2 and 7); 23E4-1 (3 and 8); 28E8-2 (4 and 9); anti-DDK plus a mix of all three peptides (5 and 10). The mAbs were detected using goat anti-mouse IgG-IRDye 800CW (green bands). The rabbit anti-clathrin heavy chain (HC) was added to all lanes and detected with goat anti-rabbit IgG-IRDye 680RD (red bands), as a protein loading control. (b). MFI of flow cytometry surface staining of HEK293_S5.1 with AF647 conjugated mAbs, as indicated; intracellular detection was performed using 28E8-2 (ICL4). Histograms indicate staining of the cells with (blue peaks) or without (red peaks) mAb pre-incubation with the respective SERINC5 peptides.
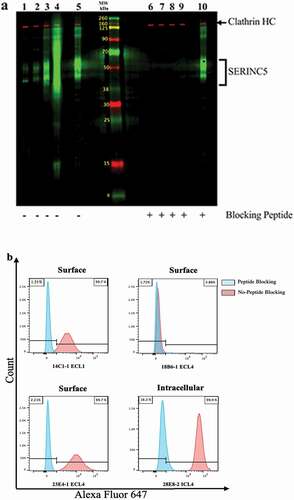
Figure 5. Immunocytochemistry staining of HEK293_S5.1 cells using the indicated SERINC5 mAbs. Cells were surface stained using 14C1-1 and 23E4-1, but internally stained using 28E8-2 and counterstained using DAPI. For panels (a, d and g) only the DAPI staining of nuclei is visualized. Panel b: surface staining (indicated by white arrows) by 14C1-1-PE (ECL1); Panel e: surface staining with 23E4-1-FITC (ECL4); Panel h: Intracellular staining (indicated by yellow arrows) by 28E8-2-FITC (ICL4); Panels c, f and i show the merged images of DAPI and SERINC5 mAb staining.
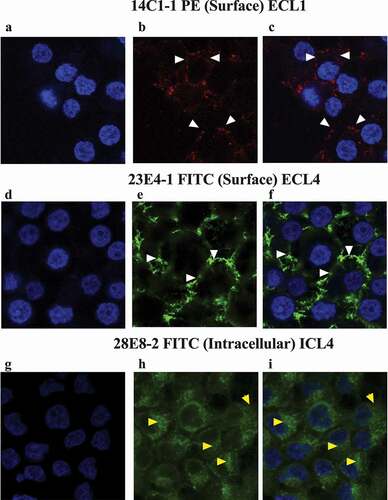
Figure 6. SERINC5 mAbs to the extracellular loops capture subtype B HIV-1(WR27). An equal amount of HIV-1WR27 (normalized by p24 core protein) was added to 96-well capture plates pre-coated with te indicated mAbs, using anti-luciferase (anti-Luc) as a negative control. The amount of virus bound by each antibody is indicated by the amount of viral p24 core protein (pg/mL) eluted from the antibodies after capture.