Figures & data
Figure 1. A. Cartoon representation of the AlbuCORE scaffold as a split Human Serum Albumin (left) and as a putative bispecific with two distinct N-terminal-fused scFv moieties (right). B. HSA sequence showing the eight AlbuCORE split points evaluated. The three residues on either side of the split position are shaded to help visualization. A simple split between two amino acids is indicated by an arrow. AlbuCORE_6 has a single amino acid deletion indicated by crossing that amino acid letter. The ubiquitous mutation C34S is indicated by a red-shaded box. C. Space-filling and cartoon depiction of the human serum albumin (HSA) and the eight engineered AlbuCORE scaffolds. The natural N- and C-termini are indicated by a red circle in the surface cartoon, while the newly created N’- and C’-termini are shown by pink boxes. Solid lines indicate the termini are facing the viewer and dotted lines indicate the termini are behind the molecule. The interchain disulfide, if present, is indicated by a black dash connecting the two chains in the block cartoons. AlbuCORE_2 and AlbuCORE_13 are the only ones without an interchain disulfide link.
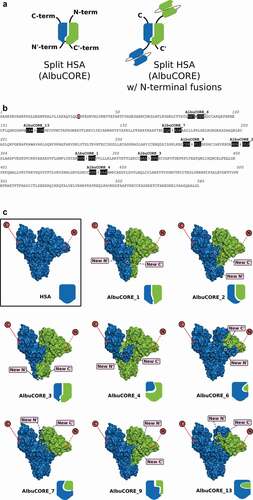
Table 1. Description of the split Human Serum Albumin (AlbuCORE) scaffolds.
Table 2. Biophysical characterization of HSA and AlbuCORE scaffolds.
Figure 2. Analysis of SEC purified HSA and the eight AlbuCORE scaffolds. A. Microfluidic Capillary Electrophoresis under non-reducing (top) and reducing (bottom) conditions. The migration of the intact HSA molecule is given as a reference point and is marked by an arrow and dotted line in both panels. The red-shaded area marks the region where the AlbuCORE_13 lower MW band (13.4KDa) was expected to elute but is not visible. B. UPLC-SEC chromatograms of all samples. The elution times were aligned for comparison, and the cartoon representation for each AlbuCORE construct is shown for easy identification. The actual elution time and calculated molecular weight for each of the UPLC-SEC runs is shown in
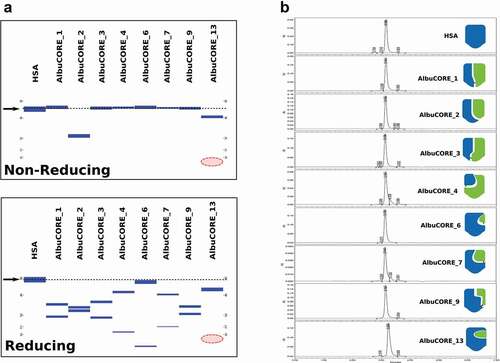
Figure 3. A. Far UV CD spectra (a) and DSC thermograms (b) of HSA and the eight AlbuCORE scaffolds. A. The inset shows a zoomed in view of the characteristic CD alpha-helix double bands between 200–230 nm. B. DSC thermograms for samples treated with 20 molar equivalents of sodium octanoate at 60°C O/N. The first transition at lower temperature (Tm1) was used to compare each of the AlbuCORE scaffolds with HSA, as reported in
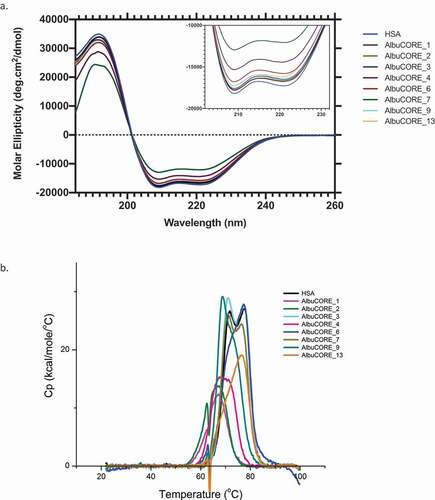
Figure 4. FACS binding of anti-HER2 scFv-fused AlbuCORE_1 constructs to HER2 positive cell line SKOV3. The constructs depicted in the top panel were devised to demonstrate the influence of valency, geometry, and fusion site on binding affinity. Affinities are depicted as bar graphs for each construct, colored according to valency. The constructs are named according to the valency (numbers 1 through 4 representing the number of scFv moieties) and according to the chain and termini used (chains A and B, N or C termini). For example, the construct 2AC-BN contains two scFv fusions (bivalent), one to chain A, C-terminal and another one to chain B, N-terminal.
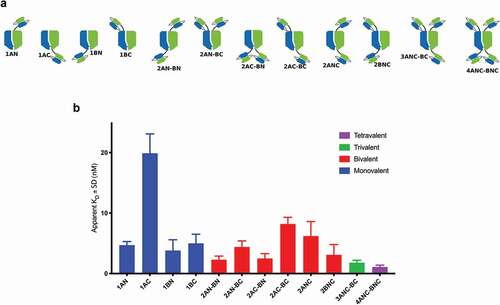
Figure 5. Internalization properties of AlbuCORE and antibody Fc fusions A. Cartoon depiction of Trastuzumab-Pertuzumab (TP) bispecific fusions with AlbuCORE and Azymetric Fc. B. Direct Internalization of AF488-labeled bispecific fusions and HSA at 200 nM in two HER positive cell lines (BT-474 and SKOV3) and a triple negative (HER2 negative) cell line (MDA-MB-231) as determined by flow cytometry. The number in parenthesis in the x-axis indicate the HER2 expression levels. C. Orthogonal method showing dose response internalization of AF488-labeled samples of bispecific, one-armed (OA-) monospecific, and unfused constructs in HER2 positive cell line BT-474, as determined using ImageXpress detection and high content imaging. The one-armed (OA) fusions were designed to preserve the format used in the bispecific fusions: scFv for Trastuzumab (OA-T) and Fab for Pertuzumab (OA-P).
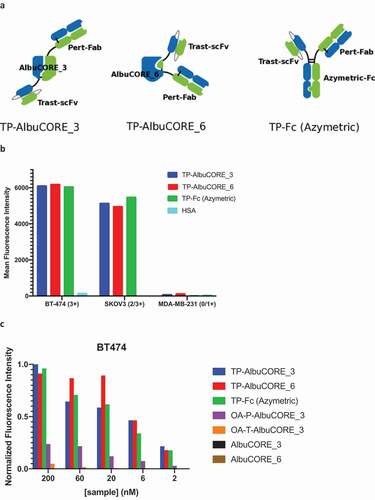
Table 3. In vitro HER2-binding affinities derived by SPR and FACS.
Table 4. PK parameters derived from the PK profiles shown in . The values in parenthesis represent the standard error of the mean.
Figure 6. Single dose pharmacokinetic (PK) profiles of HSA and AlbuCORE molecules in Tg32/AlbKO mice at 1 and 10 mg/Kg. The PK parameters derived from these profiles are shown in Table 4.
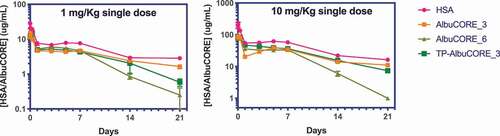
Figure 7. Stochastic conjugation of DM1 to lysine residues. Drug to protein (antibody, Albumin or AlbuCORE) ratio achieved using different molar ratio of the linker drug (SMCC-DM1) relative to the protein. DARs determined using spectroscopic techniques. A Conjugation of the scaffolds Albumin, AlbuCORE or homodimeric IgG1 Fc fragment, all constructs lacking fused paratopes (scFv or Fab units). See Figure 2A for cartoon representation of the scaffolds. B Conjugation of the anti-HER2 biparatopic AlbuCORE or Fc-based constructs (Trastuzumab scFv and Pertuzumab Fab, TP-), as shown in Figure 5A.
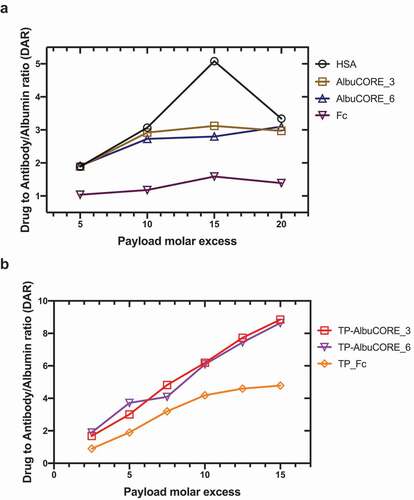
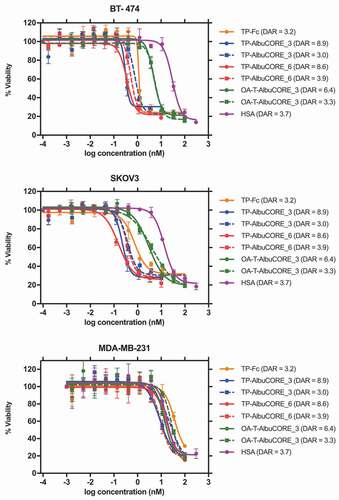
Figure 8. Cytotoxicity profile of DM1-conjugated IgG1 Antibody or AlbuCORE constructs (see Figure 5A) targeting HER2 in three different cell lines SKOV3 (HER2 high), BT-474 (HER2 high) and MDA-MB-231 (HER2 negative). DAR values are indicated in parenthesis in the figure legend. For comparison reasons, a sample with DAR ~ 3 was tested for each one of the constructs. In addition, for each AlbuCORE construct the sample with the highest DAR obtained was also tested. The drug conjugated HSA (untargeted) is presented as a control. OA-T-AlbuCORE_3 is the one-armed version of AlbuCORE_3 fused to a Trastuzumab scFv.