Figures & data
Table 1. The percentage of complex biantennary and high mannose afucosylated species and the potency of FcγRI, FcγRIIa, and FcγRIIIa, relative to the standard. The N-glycan profiles were analyzed on a HILIC column by UPLC. The binding affinity for FcγRI was determined by a TR-FRET assay, while AlphaScreen was used to assess FcγRIIa and FcγRIIIa binding. Full concentration response curves were performed and IC50 values were calculated by non-linear regression analysis. Each sample was run alongside the standard and the effect the afucosylated species had on the potency of aducanumab was calculated by dividing the IC50 of the standard by the IC50 of the samples. Each sample was tested in duplicate or triplicate and n = 2–3. Since a ratio was calculated, only mean is provided.
Figure 1. Comparison of the ADCP activity of different afucosylated forms to the aducanumab standard in the BV-2 cell line. Aβ-GFP phagocytosis was quantitated by flow cytometry, with the percent positive GFP cells of 1000 cells sampled per sample shown. Concentration response curves for each of the afucosylation samples were performed alongside the standard. Samples were run in duplicate or triplicate. Mean ± S.E.M. and non-linear regression curve fit analysis are shown. (a) FcγRIIIa enriched afucosyl isoforms (FcγRIIIa-afuc) and kifunensine-generated high mannose isoforms (HM-Afuc) have similar dose-dependent Aβ phagocytosis activity as the standard (two-way analysis of variance (ANOVA) for standard vs sample, p >.05; n = 4–7). (b) Complex biantennary afucosylated anti-Aβ (CB-Afuc) has similar dose-dependent Aβ phagocytosis activity as the standard (two-way ANOVA for standard vs sample, p >.05; n = 7).
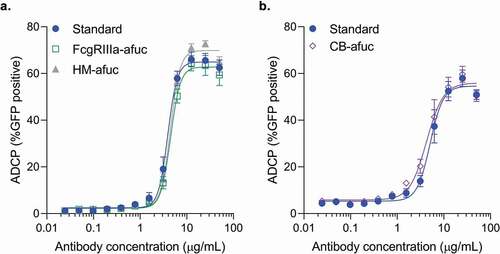
Figure 2. Antibody-mediated Aβ uptake in human cell systems. (a-c) Mean number of Fc Receptors determined using the QuantiBRITE PE kit on two different human macrophage preparations derived from human peripheral CD14+ monocytes (A, n = 1–2) and on the human THP-1 cell line (B, n = 2). Mean ± S.E.M. are provided. (c) Kifunensine high mannose sample (HM-Afuc) has similar dose-dependent Aβ phagocytosis activity as the standard mediated by primary human macrophages (two-way ANOVA for standard vs sample, p >.05; n = 3). Results are presented as the relative ADCP fluorescence unit (RFU) as measured using the trypan blue exclusion method versus antibody concentration. Mean ± S.E.M. and non-linear regression curve fit analysis are shown. (d) HM-Afuc has similar dose-dependent Aβ phagocytosis activity as the standard mediated by the THP-1 cell line (two-way ANOVA for standard vs sample, p >.05; n = 4). Samples were run in duplicate and Aβ-GFP phagocytosis was quantitated by flow cytometry. The mean ± S.E.M. of the percent positive GFP cells of 1000 cells sampled per sample and non-linear regression curve-fit analysis are shown.
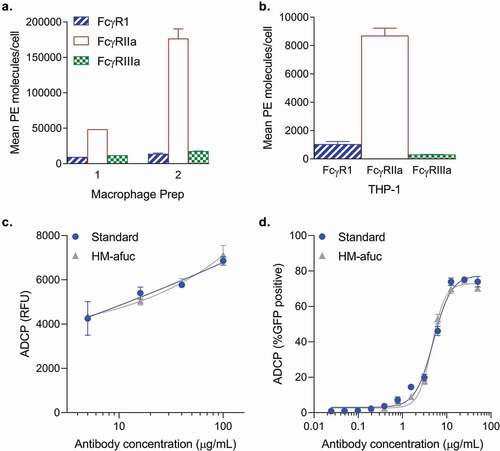
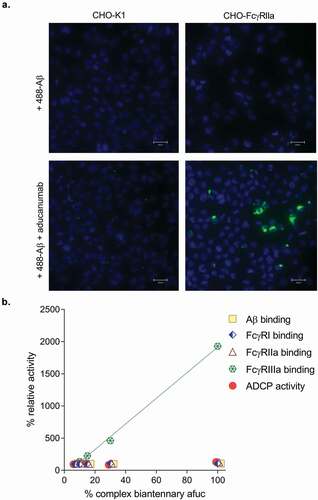
Figure 3. (a) Representative fluorescent images of aducanumab-mediated uptake of Alexa488-labeled Aβ (488- Aβ) aggregates. Following treatment with 488- Aβ with or without aducanumab, external fluorescence was quenched with trypan blue. No aducanumab-stimulated uptake was observable in wild-type CHO-K1 cells; however, 488- Aβ was internalized by aducanumab in cells expressing FcγRIIa (CHO-Fcγ-RIIa). No 488-Aβ was taken up into cells in the absence of aducanumab. Nuclei are stained with DAPI (scale bars represent 25 µm). (b) A 100% complex biantennary afucosylated sample was generated and then mixed with aducanumab standard to create blends with 7%, 10% 15% and 30% afucosylation. Each sample was tested in duplicate or triplicate for binding affinity for Aβ, FcγRI, FcγRIIa and FcγRIIIa and Aβ ADCP activity. The relative potency versus the antibody standard was calculated for each blend in each assay, and the results are plotted as a percent. FcγRIIIa binding was analyzed by linear regression analysis (RCitation2 = 0.998).