Figures & data
Figure 1. Affinity maturation workflow. DNA sequences encoding four antibodies, targeting CTLA-4, OX40, PD-1, and PD-L1, were first cloned into scFv formats before undergoing mutagenesis using two distinct methods. The VariantFind method aimed to mutate two amino acids within the six CDRs of the light and heavy chains, whereas the epPCR method aimed to mutate three amino acids anywhere along the entire scFv sequences (* represents mutation). The libraries were transformed into a yeast scFv display system and sorted against their respective antigens with three rounds of FACS. The libraries were sequenced via Pacific Biosciences (PacBio) long read sequencing before and after sorting. Enriched sequences were selected and cloned as full-length antibodies or scFvs, and their affinities were measured using soluble or cell surface-expressed antigens.
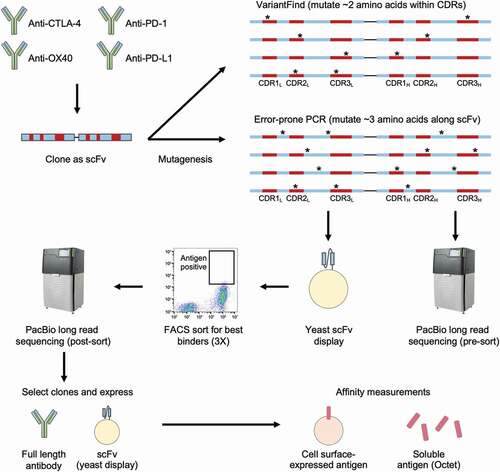
Table 1. KD measurements for the four parental antibody clones (tPD1.16, tCTLA4.28, tPDL1.3 and tOX40.24) before being subjected to affinity maturation campaigns, measured using SPR and BLI.
Figure 2. Mutational profiles of in vitro mutagenized antibody libraries as assessed by Pacific Biosciences sequencing. (a) Boxplots showing the number of amino acid mutations in each library relative to the parental antibody sequences. (b) Categorization of nucleotide changes in the epPCR mutagenized libraries. The expected mutational frequency (Mutazyme II) is presented for comparison. (c) Amino acid mutation frequency along light (left panel) and heavy (right panel) chain sequences. The x-axis represents amino acid position according to the IMGT annotation. The y-axis represents mutation frequency as percentage of the total number of mutations for a given library. EpPCR and VariantFind libraries are color coded as indicated in the legend. CDR regions are shaded in yellow. (d) Predicted and observed mutational distributions based on classification of amino acid side chain properties (polar, nonpolar, positively and negatively charged).
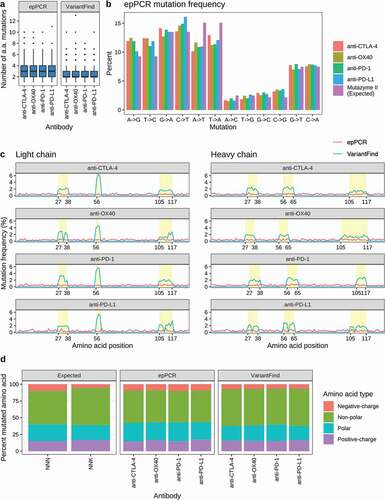
Figure 3. Flow cytometry profiles for parental scFv yeast clones, epPCR, or VariantFind mutagenized libraries, and post-sort libraries. (a) EpPCR mutagenized samples. (b) VariantFind mutagenized samples. Each row from left to right represents the following samples: parental strain, unsorted mutagenized library, and one, two, or three times sorted libraries, all stained with the relevant soluble antigen. The y-axis reflects antigen binding, whereas the x-axis displays scFv expression through staining of the c-myc tag.
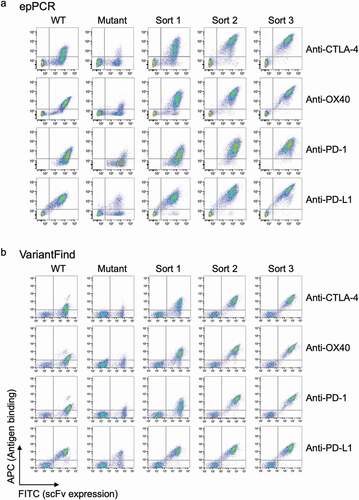
Figure 4. Sequence characteristics the mutagenized libraries after FACS sorting. (a) Boxplots showing the number of amino acid mutations in each library relative to the parental antibody sequences. Pre- and post-sort libraries are shown in blue and orange, respectively. P-values were determined using Wilcoxon rank sum test (**p < .0001, *p < .05, ns = not significant). (b) Library diversity post-FACS enrichment. The panels represent the 8 mutagenized libraries (top = epPCR, bottom = VariantFind). The x-axis shows the top 10 clones ranked by abundance, while the y-axis shows their percent abundance, as measured by percent sequencing reads, in the respective libraries. The bars are color-coded to indicate the number of amino acid mutations in the clones. (c) Distribution of mutations in different antibody regions (FR = framework region, CDR = complementarity-determining region) on the light (l) and heavy (h) chains. The y-axis represents percent mutation, normalized by the number of amino acids in a given region, relative to the total number of mutations in the library. The blue and orange bars represent pre- and post-sort libraries, respectively. CDR regions are shaded in yellow.
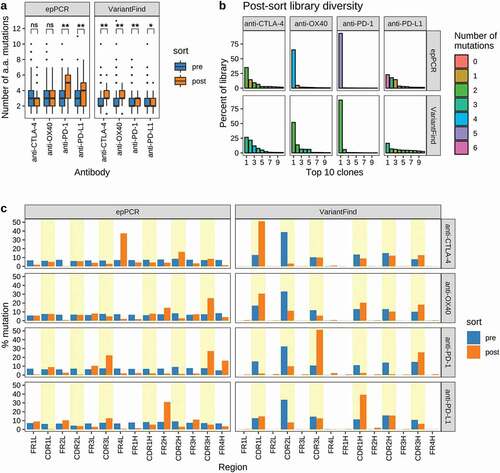
Table 2. KD measurements for parental and epPCR derived full-length antibodies and their corresponding scFv clones, measured using BLI.
Table 3. KD measurements for parental and VariantFind derived full-length antibodies and their corresponding scFv clones, measured using BLI.
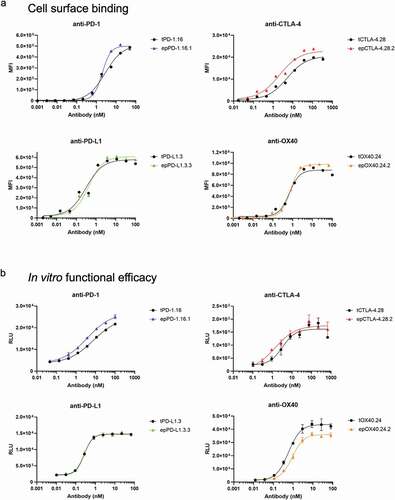
Table 4. Functional assessment (cellular binding and cellular activation in vitro) of a selection of full-length antibodies. Cell surface binding and functional efficacy EC50 values are derived from titration curves presented in ,b.
Figure 5. Analysis of affinity-matured full-length antibodies. (a) Cellular titrations of full-length antibodies. Cells were incubated with a dilution series of each antibody, then antibody binding was detected by a PE-labeled antibody against the Fc region. Binding is measured by median fluorescent intensity (MFI) of the PE channel. (b) Functional assessment of inhibition (for anti-PD-1, anti-PD-L1, and anti-CTLA-4) or agonism (anti-OX40) using Promega in vitro efficacy assays. Inhibition or agonism is measured by relative luminescence units (RLUs) across a dilution series of each antibody. Antibodies were tested in duplicate (anti-PD-1, anti-PD-L1) or triplicate (anti-CTLA-4, anti-OX40). Average ± standard deviation is shown. For all plots, parental antibodies and variants are shown in black and color, respectively. Derived EC50 values are listed in.