
Figures & data
Figure 1. Domain architecture of the antibodies and antibody fusion proteins investigated in this study.
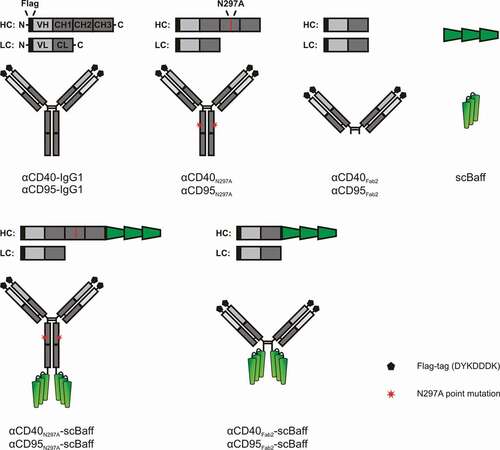
Table 1. Affinity of GpL-tagged TNC-Baff and CD40- and CD95-specific antibody-scBaff fusion proteins for cell-expressed receptors.
Figure 2. Equilibrium binding of GpL-tagged aCD40- and αCD95-scBaff fusion proteins to CD40 and CD95 and the Baff-interacting receptors BaffR, TACI and BCMA. (a,b) HEK293 transfectants transiently expressing the Baff-interacting receptors (a) or CD40 or CD95 (b) were used to determine total binding. Empty vector (EV) transfected cells were used to determine unspecific binding. Specific binding was calculated by subtraction of the unspecific binding values from the corresponding total binding values. Binding of GpL fusion proteins of TNC-Baff and TNC-APRIL was analyzed for comparison. Data of one representative experiment for each of the investigated interactions are shown. Averaged KD-values of 4 independent experiments are listed in .
Figure 3. Effect of FcγR- and BaffR-binding on the agonistic activity of CD40- and CD95-specific antibodies and antibody-scBaff fusion proteins. (a,b) HT1080-CD40 (a) and HT1080 cells (b) were seeded in 96-well plates and were incubated the next day with HEK293 cells transiently transfected with empty vector (EV) or expression plasmids encoding the stimulatory Fcγ receptor FcγRIa, the inhibitory Fcγ-receptor FcγRIIb or BaffR along with increasing concentrations of the indicated CD40- (a) and CD95-specific (b) antibodies and antibody fusion proteins. In the case of the CD95-specific reagents 2.5 µg/ml CHX was added to sensitize HT1080 cells for apoptosis induction. The next day, CD40-mediated IL8 induction was quantified by ELISA (a) and CD95-induced apoptosis was quantified by crystal violet staining of the surviving adherent cells (b).
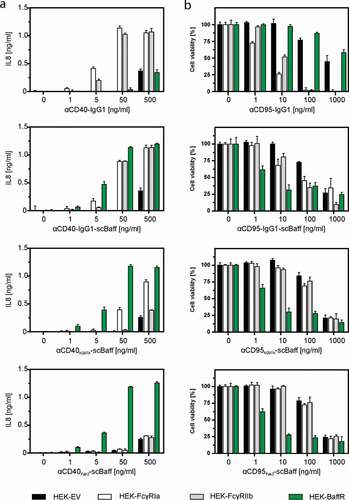
Figure 4. CD40 stimulation by purified αCD40N297A-scBaff. (a) The indicated proteins were purified by affinity purification on anti-Flag agarose and were analyzed by SDS-PAGE and silver staining. (b) Gel filtration analysis of the various purified αCD40 variants. The low molecular weight peaks marked by the black arrows indicate the position of the Flag peptide used for elution of the Flag-tagged antibodies. The red arrows indicate the peak of the dimeric IgG1/Fab2 fusion proteins. The left panel shows the analysis of a mixture of protein standards of known size. The positions of the 17, 150 and 670 kDa marker proteins are indicated. (c) HT1080-CD40 were seeded in 96-well plates and were challenged the next day with HEK293 cells transiently transfected with empty vector (EV) or expression plasmids encoding the indicated receptors along with increasing concentrations of αCD40N297A-scBaff. Next day, CD40 activation was evaluated by analysis of IL8 production by ELISA. (d) Co-cultures as described in “C” were pretreated for 30 min with or without 5 µg/ml Flag-TNC-Baff and were then stimulated with 200 ng/ml of αCD40N297A-scBaff before IL8 production was evaluated the next day by ELISA. (e) U2OS cells seeded in 96-well plates were challenged the next day with 4 × 10⁴ MM.1S, L363, BJAB or Jurkat cells along with the indicated concentrations of αCD40N297A-scBaff. One day later, CD40 activation was again evaluated by assaying IL8 production by ELISA. (f) Cells were again seeded in 96-well plates and were supplemented the next day as indicated with 4 × 10⁴ MM.1S, L363, BJAB or Jurkat cells. Co-cultures were pretreated for 30 min with or without 5 µg/ml Baff-TNC, were then stimulated with 200 ng/ml of the CD40-specific antibody-scBaff fusion proteins and the next day CD40 activation was again assessed by means of IL8 ELISA.
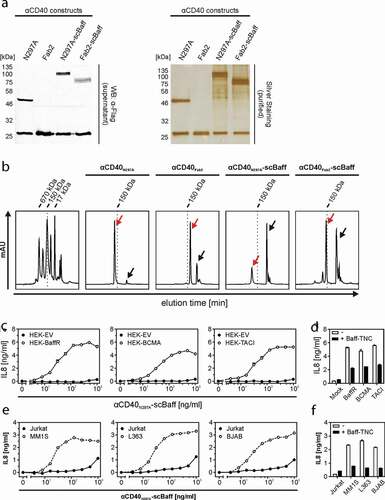
Figure 5. Lymphoma- and myeloma cell-restricted activation of CD95 by antibody-scBaff fusion proteins. (a) HT1080 were cultivated in 96-well plates and were challenged in the presence of 2.5 µg/ml CHX with 4 × 10⁴ L363, BJAB or Jurkat cells along with αCD95N297A-scBaff and αCD95Fab2-scBaff. Next day, remaining viable plastic adhered cells were quantified by crystal violet staining. (b) HT1080 cell were again seeded in 96-well plates and were supplemented the next day as indicated with 4 × 10⁴ L363, BJAB or Jurkat cells. Co-cultures were pretreated for 30 min with or without 5 µg/ml Baff-TNC and were then stimulated with 20 ng/ml of the αCD95-antibody scBaff fusion proteins, respectively. On the next day, CD95 activation was evaluated by determination of cellular viability. (c) Cocultures of HT1080 with 4 × 10⁴ MM.1S, L363, BJAB or Jurkat cells were cultivated in 96-well plates and were challenged in the presence of 2.5 µg/ml CHX and 20 µM zVAD along with αCD95N297A-scBaff and αCD95Fab2-scBaff. On the next day, NFκB signaling was assessed by means of IL8 ELISA. (d) Co-cultures were set up as in “C” and were pretreated for 30 min with or without 5 µg/ml Baff-TNC. Cells were then stimulated with 20 ng/ml of the αCD95-antibody scBaff fusion proteins and on the next day CD95-mediated IL8 production was again assayed by ELISA.
