
Figures & data
Figure 1. Distortions in the sedimentation boundaries and apparent sedimentation coefficient distributions in nonideal sedimentation. a, Measured concentration profiles of 37 mg/mL mAb A at select times during sedimentation at 45,000 rpm (solid lines; later times indicated by higher color temperature) in comparison with the theoretical sedimentation of a macromolecule with sedimentation properties as measured for the monomer or mAb A under dilute conditions (dotted lines; corresponding to a species with 6.5 S and frictional ratio 1.6). b, Lines show different sedimentation coefficient distribution models derived by fitting the sedimentation data: standard c(s) with unphysical best-fit f/f0 of 4.0 (blue); apparent sedimentation coefficient distribution g*(s) (purple); and nonideal cNI(s0) fixing f/f0 at 1.6 as measured in dilute solution by ideal c(s) analysis (magenta). The dashed vertical line indicates the s-value of the mAb A monomer measured at 100-fold lower concentration in dilute solution. In (a) and (b) the boundary and distribution features corresponding to trace aggregates are highlighted by shaded areas (arrows).
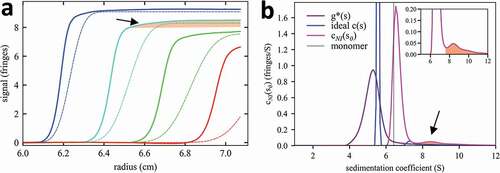
Figure 2. Comparison of measured sedimentation boundaries of mAb A (a) and mAb D (b). Concentrations are 37 mg/mL for mAb A and 46 mg/mL for mAb D, and sedimentation at 45,000 rpm is represented by every 10th data point (points) of every 3rd scan (time intervals of 120 sec). The solid line is the best-fit nonideal cNI(s0) model fixing the frictional ratio f/f0 at the value measured in dilute solution, while refining the best-fit values for kS and kD (see Table 1). This results in a ratio of rmsd/loading signal of 0.42% for mAb A and 0.41% for mAb D. The corresponding best-fit sedimentation coefficient distributions cNI(s0) are shown in Figure 3.
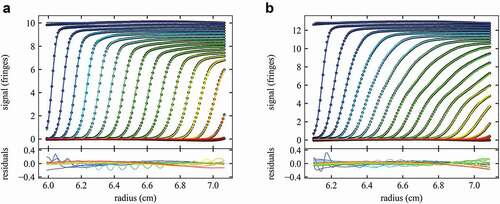
Figure 3. Different protein interactions exhibited by a panel of different mAbs A – E. Shown are concentration-dependent sedimentation coefficient distributions cNI(s0) of the mAb at concentrations indicated in the legend. Insets expand scale > 7 S.
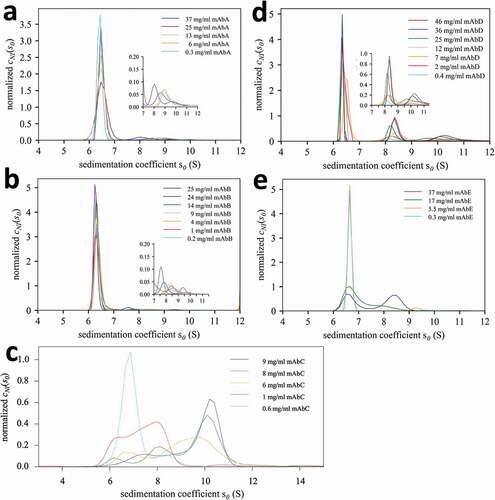
Figure 4. Isotherms of weighted-average sedimentation coefficients sw (symbols) and best-fit self-association models (lines) for different mAbs. sw-values were determined by integration of the cNI(s0) distribution of Figure 3. For best-fit self-association parameters, see Table 1.
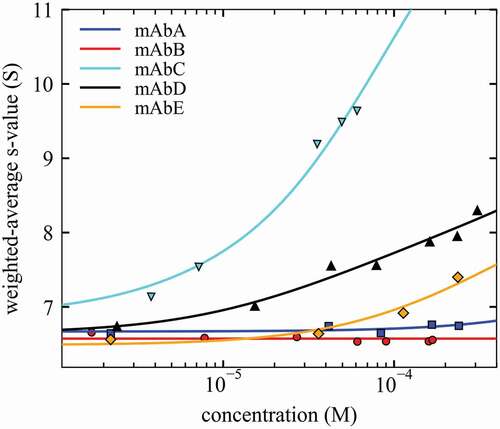
Table 1. Best-fit binding parameters from the analysis of concentration-dependence of sedimentation.