Figures & data
Table 1. Site-directed mutagenesis to introduce the consensus N-linked glycosylation sequence NXS/T around the native Asn297 site and LC-MS characterization of mAb1 Fc mutant antibodies.
Figure 1. Protein characterization of mAb1 wild-type and various glycosylation mutants. (a) SDS-PAGE analysis of the mutants under reducing condition (lane 1: protein molecular weight , or MW, standards; lane 2: wild-type mAb1; lane 3: N297Q; lane 4: N299A; lane 5: QNTS; lane 6: NNAS; lane 7: NNTS). Asterisk shows migration of the heavy chains of glycovariants under reducing condition. (b) Deconvoluted spectra from intact protein LC-MS analysis of NNAS. The antibody heavy chains with different N-glycans are shown.
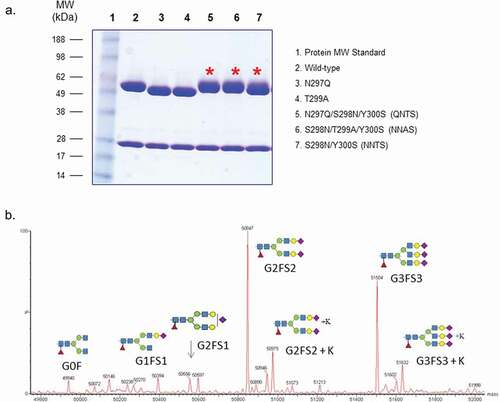
Table 2. Characterization of various Fc mutants of mAb1.
Figure 2. Comparison of FcγR binding of mAb2 wild-type, NNAS and other Fc mutants. (a) The interactions of wild-type IgG1, IgG4 PE, IgG1 LALA, IgG1 N297A, and IgG1 NNAS with human and mouse FcγRs were investigated using SPR. The sensorgrams show the binding profiles of IgG antibodies at various concentrations to different FcγRs. (b) The sensorgrams reveal the interactions of different subclasses of wild-type and NNAS mutants with human and mouse FcγRs. FcγRIIa (R131) and FcγRIIIa (V158) allotypes were used in the characterization.
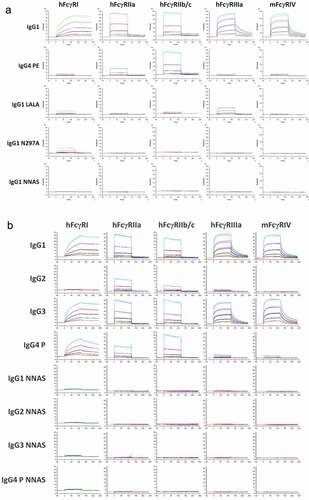
Figure 3. Comparison of the in vitro effector functions of mAb2 wild-type, NNAS and LALA mutants. (a) ADCC activities represent percent specific target cell lysis by effector cells in the presence of various concentrations of antibody mAb2. Monoclonal human cytotoxic T lymphocytes transduced with human FcγRIIIa (V158) was used as effector cells. (b) CDC activities show the percentage of specific target cell lysis by complement in the presence of various amounts of antibody mAb2. Data are presented as mean and standard deviation from triplicates.
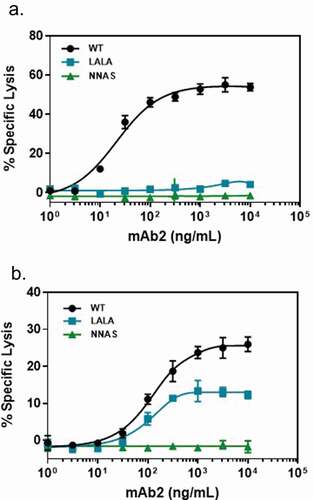
Figure 4. Comparison of the in vivo lymphocyte depletion of wild-type and NNAS mutant. (a) T cell depletion was determined in human antigen-specific transgenic mice (n = 10 per group) at different timepoints after injected with mAb1 wild-type and NNAS mutant. (b) B cell depletion was measured in human antigen-specific transgenic mice (n = 10 per group) at various timepoints after injected with mAb1 wild-type and NNAS mutant.
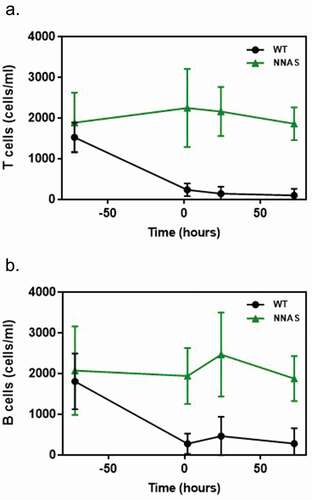
Figure 5. Crystal structure of NNAS Fc mutant. (a) Overall structure of NNAS Fc. The two Fc chains are colored in cyan and green. Visible glycans at N298 are shown in stick representation, with carbon atoms in gray. (b) Superposition of NNAS Fc with wildtype Fc (PDB 1FC1, 3AVE, and 2DTS.Citation25,Citation26 The carbon atoms in 1FC1, 3AVE, and 2DTS Fc are colored in different shades of gray. NNAS Fc is colored as in A. (c) Superposition of NNAS Fc with Fc-FcγRIII. For simplification, only PDB 3AY4Citation27 was shown, since PDB 1E4KCitation11 gave near identical results. NNAS is colored as in A. Wild-type Fc was colored in white while FcγRIIIα was colored in light pink. (d) Superposition of NNAS Fc with Fc-FcγRII (PDB:3RY6).Citation28 The color scheme is same as C. The glycans on N298 of the NNAS Fc all clash into the respective receptors. All oxygen atoms are colored in red and nitrogen atoms colored in dark blue. All figures are generated in Pymol.Citation29
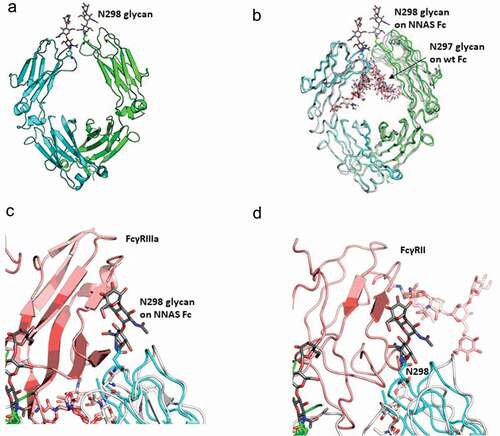
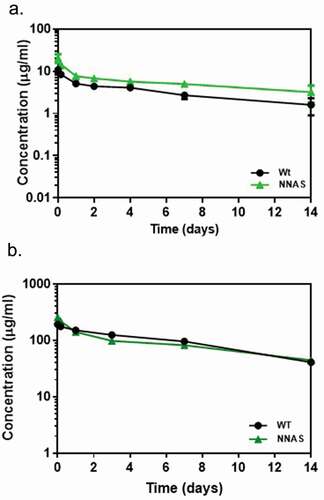
Figure 6. Comparison of pharmacokinetic profiles of wild-type and NNAS mutant. (a) PK profile in mouse (n = 10 per group) injected with 1 mg/kg of mAb1 wild-type and NNAS mutant. (b) PK profiles in cynomolgus monkeys (n = 3 per group) following administration of mAb2 wild-type and NNAS mutant. The wild-type and NNAS mutant of mAb1 and mAb2 were produced from CHO cells.