Figures & data
Table 1. mAb characteristics, calculated from the structures of the entire antibodies. pI data from Sudrik et al.Citation28.
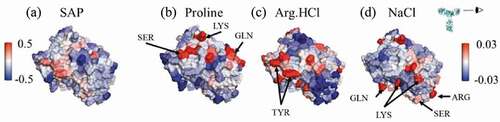
Figure 1. Views of the Fv domains, side-on, as indicated by the eyeball in the inset, so that the figures include all complementarity-determining regions. The figures are colored by the atomic SAP and atomic SCM scores. Each antibody has some hydrophobic regions on the Fv, indicated by red coloring in the SAP figures, although mAbC has the most exposed hydrophobicity. The SCM coloring indicates mostly positive charge (blue) on mAbA, both positive and negative charges on mAbB, and mostly negative charge on mAbC.
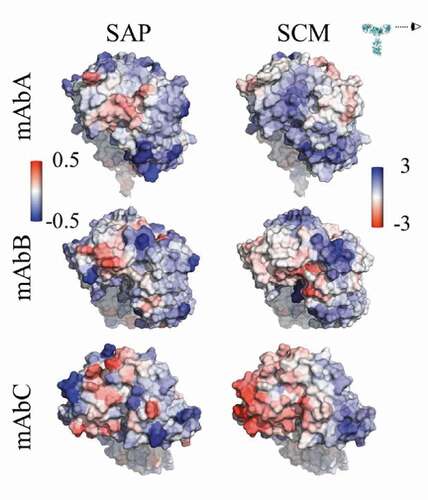
Figure 2. Preferential interaction coefficients of mAbs A, B, and C with proline, arginine, and NaCl. Simulations with proline and arginine were performed using the force field parameters previously described. Parameters for all other atoms are from the CHARMM36m force field. With the exception of mAbC in Arg.HCl, there is generally good agreement between simulation and experiment. Experimental measurement of of mAbB in NaCl was only carried out below about 0.2 m NaCl due to phase separation at higher NaCl concentrations.
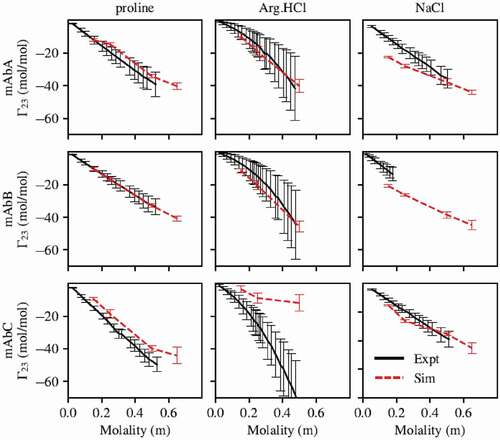
Table 2. σ (nm) values for proline.
Table 3. Force field parameters for Arg.HCl. Note that the σ values for all Arg atoms (except for N, H, O, and Cl interactions with other Arg.HCl molecules or water) were scaled by 1.05.
Figure 3. Sums of the local values for different types of residues in the Fv domains. Values taken from simulations with the excipients at 0.15 m bulk concentration. For all three antibodies, proline is net excluded from all types of residues in the Fv. Interestingly, for all three antibodies, Arg.HCl and NaCl show opposite net inclusion/exclusion behaviors with negative residues.
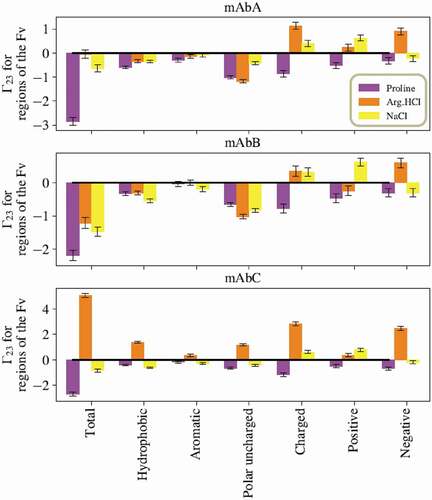
Figure 4. A representative snapshot from a simulation of mAbB in 0.5 m proline showing a view of part of the Fv domain. It shows several proline excipient molecules interacting with exposed TYR residues. The local value with the three labeled TYR residues is 0.13 ± 0.01, which is significantly higher than the expected interaction if proline interacted only an average amount (−0.07 ± 0.01). Antibody residues are colored by the local Γ23 value.
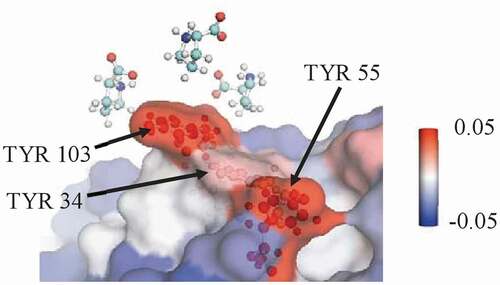
Figure 5. (a) The ratio of monomer loss rates in the presence of 100 mM excipient (ke) and in buffer alone (kb, 25 mM sodium acetate, pH 5.5) was determined at 52.5°C for mAbs A and B and 42.5°C for mAbC. (b) The viscosity of the antibodies at 100 mg/mL in buffer alone or in 100 mM excipient. (c) The diffusion interaction parameter kD. For mAbs, values below −8.9 mL/g indicate attractive self-interactions.
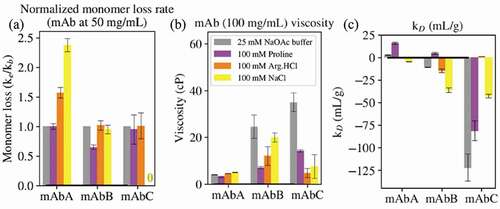
Figure 6. Views of the variable region of mAbC. (a) Coloring indicates SCM values, with red coloring indicating exposed negative charge. (b)-(d) Coloring indicates local Γ23 values for proline, Arg.HCl, and NaCl, respectively, with bulk excipient concentrations of 0.15 m. Red indicates preferential inclusion. All three excipients show some positive interactions with at least part of the negatively charged patch shown in (A). Views are of the Fv domain, side-on, as indicated by the eyeball in the inset, so that the figures include all complementarity-determining regions.
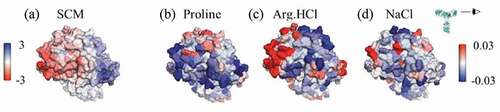
Figure 7. Views of a portion of the mAbC Fv. (a) is colored by the SAP score, with red indicating exposed hydrophobicity. (b) and (c) are colored by the local values with Arg.HCl and NaCl, respectively, with red indicating inclusion. Values are taken from simulations with bulk excipient concentrations of 0.15 m. Arg.HCl is net included in the circled high-SAP patch (
), while NaCl is net excluded from this patch (
). Views are of the Fv domain, side-on, so that the figures include all complementarity-determining regions, albeit from a slightly higher angle than in so as to view the whole high-SAP region, circled.
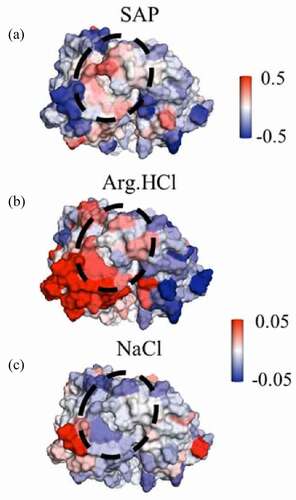
Figure 8. Views of the variable region of mAbB. (a) Coloring indicates SAP values, with red coloring indicating exposed hydrophobic regions. (b)-(d) Coloring indicates local Γ23 values for proline, Arg.HCl, and NaCl, respectively, with bulk excipient concentrations of 0.15 m. Red indicates preferential inclusion. Views are of the Fv domain, side-on, as indicated by the eyeball in the inset, so that the figures include all complementarity-determining regions.