Figures & data
Table 1. Biophysical properties of antibodies. Table shows the melting temperature (Tm) and temperature of the onset of aggregation (Tagg). The expression yield represents the yield from transient transfection after protein A purification. C-max is the highest concentration achieved by ultra-filtration (>x indicates that the upper concentration limit of precipitation and blocking of the filter was not achieved). Dynamic light scattering measurements include the cumulant z-average size (Z-Av) and polydispersity index (PDI)
Figure 1. Distinguishing developable antibody by mammalian cell display. Flow cytometry plots of HEK293 (A and B) and yeast cells (D and E) displaying the Ang2 pair (A and D, respectively) or MEDI-1912 pair (B and E, respectively) on the cell surface. Histogram plots represent the cell count (x-axis) plotted against fluorescence intensity of anti-Fc-PE stain) for non-transfected cells (gray, filled), parental antibody (blue) and improved antibody (red). C and F show a scale representations of antibody presentation by mammalian cell display and yeast display, respectively
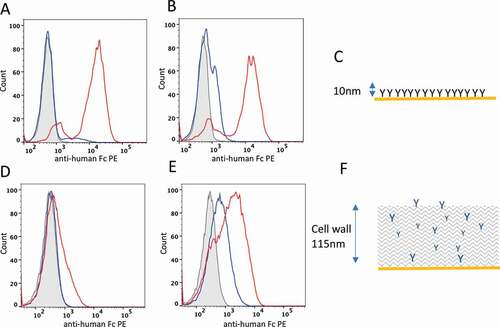
Figure 2. FACS separation of the MEDI-1912 variants based on antibody presentation level. A. Histogram plot of HEK293 population targeted by nuclease-directed integration with an equal mix of MEDI-1912 parent and MEDI-1912 STT variants. Gates 1 and 2 represent the sorting gates used to sort the 2 populations. B. MEDI-1912 mammalian display library was constructed based on mutagenesis of amino-acid position 30, 31 and 56. Cells were stained with anti-Fc-PE (x axis) and NGF-biotin/streptavidin-APC (y axis). The gate chosen for sorting is represented as a box on the dot-plot
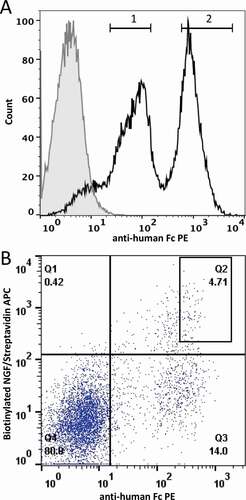
Table 2. Biophysical properties of selected MEDI-1912 variants. Table shows the highest antibody concentration achieved by ultra-filtration (C-max). Dynamic light scattering measurements include the cumulant z-average size (Z-Av) and polydispersity index (PDI)
Table 3. Biophysical properties of bococizumab VH CDR2 variant antibodies. The top 12 enriched bococizumab VH CDR2 variant antibodies were expressed and purified and tested in an AC-SINS assay, HPLC-SEC and a specificity ELISA. Antibody variants are named according to the amino acid identity at positions 52, 54 and 57. Values shown are relative enrichment of clones in high mammalian display population, the AC-SINS wavelength shift (nm), the HPLC-SEC column retention volume (Vr (ml) in 2xPBS and an ELISA signal for binding to bovine serum albumin-blocked polystyrene microtiter plate wells
Figure 3. Engineering bococizumab by random mutagenesis of selected paratope residues. A. Structure of bococizumab bound to PCSK9 (PDB: 3SQO).Citation18 Upper panel depicts PCSK9 as a yellow ribbon structure and bococizumab as a molecular surface with its hydrophobic, positive, and negative patches shaded green, blue and red, respectively. The lower panel depicts a zoomed in image of the VH region that was mutated. The left panels show wild-type bococizumab and the right panels show a model of the bococizumab VH variant S52N, F54S R57S. Dot plot of HEK293 cells displaying either B. the mutagenized VH library of bococizumab, or C. the mutagenized VH and VL bococizumab library stained with biotinylated PCSK9 (y-axis) and anti-human Fc PE (x-axis)
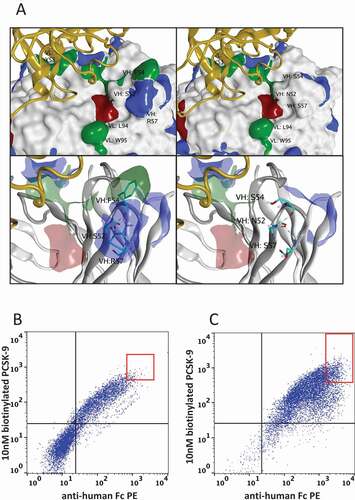
Figure 4. HPLC-SEC analysis of bococizumab variants. Purified antibodies were loaded on a Superdex 200 column integrated in an Agilent 1100 HPLC instrument. Absorbance at 215 nm is plotted against elution volume for each antibody. In each plot samples are compared against the problematic bococizumab (labeled SFR) and the NDD variant, which is a well-behaved positive control. Samples are named according to amino acid substitution at positions 52, 54 and 57 within the VH CDR2. A. NFR, B. SFD, C. SDR, D. NFD E. NDR, F. SDD
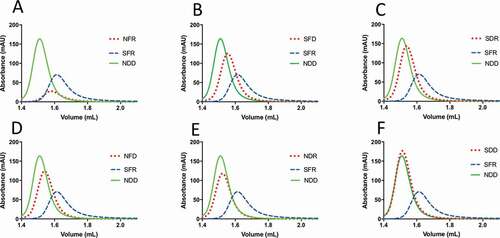
Table 4. Elution profiles of point mutations on HPLC-SEC. Retention volume for point mutations was calculated and compared to the elution volume of the well-behaved “NDD” clone. The difference in elution volume compared to “NDD” was calculated and the volume for bococizumab was designated as 100%. The relative percentage change in elution volume of the variants compared to bococizumab is shown
Table 5. Post-purification yields and DLS scores of bococizumab VH CDR2 variant antibodies at different concentrations. The yields of selected antibodies is expressed as the yield of antibody (mg) per liter of expression culture volume (yield calculated following expression, Protein A affinity chromatography and dialysis . Antibodies were concentrated by ultra-filtration and the particle size measured by DLS using a Malvern Zetasizer Nano S. The Z average (the intensity weighted mean hydrodynamic size of the ensemble collection of particles) (Zav) was measured at 1, 10 or 40 mg/ml antibody concentrations (*with the exception of the NFR variant, which was measured at 30 mg/ml)
Figure 5. Induction of proliferation of CD4 + T cells by bococizumab and bococizumab variants selected by mammalian display. A. PBMCs from 10 individual haplotyped human donors (labeled D1 to D10) were labeled with CFDA-SE. After 8 days the cells were analyzed with an iQue screener flow cytometer (Intellicyt) where the viable singlet CD3+ CD4+ gated cells (see Supplementary Figure 7 for gating strategy) were analyzed for CFSE mean fluorescence intensity (MFI). The dot plot (A) shows the stimulation index (SI) for each donor. The SI was calculated by the average percentage of divided cells (% of parent) plus antibody or KLH divided by the average percentage of divided cells in the media only control samples. B. The average response index (RI) is calculated by averaging SI values across donors and multiplying by the percentage frequency of donors responding (p < .05 SI≥2). RI could not be calculated for Trastuzumab, Bevacizumab, Alirocumab and NEI due to a lack of samples meeting positive hit cut off criteria. C. Mean SI for all 10 donors for each antibody or antigen used for stimulation
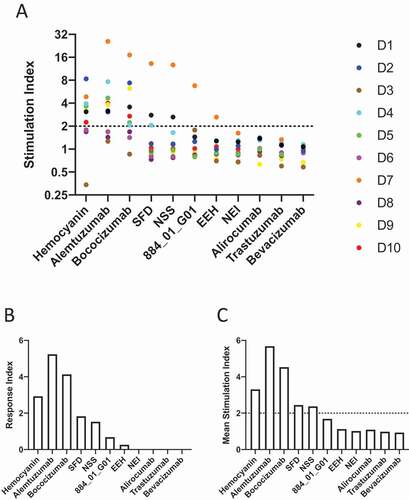
Figure 6. Up-regulation activation markers on CD3+ CD4 + T lymphocytes by bococizumab and bococizumab variants selected by mammalian display. PBMCs from 10 individual haplotyped human donors (labeled D1 to D10) were incubated with different antibodies or KLH. After 8 days, the cells were stained with anti-CD3, anti-CD4, TO-PRO™ −3 and either A. anti-CD69, B. anti-CD25, C. anti-CD71 or D. anti-CD40L and analyzed by flow cytometry. SI was calculated by the percentage of marker positive cells plus antibody or KLH divided by the percentage of marker positive cells in the media only control sample
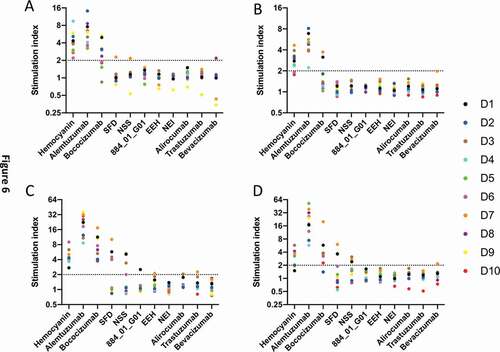
Figure 7. Screening for polyreactivity by mammalian display. Dual staining with (a) Heparin-FITC, (b) Hsp70 or (c) Hsp90 (x-axis) and anti-human Fc APC (y-axis). Dot plots showing overlay of ustekinumab (gray) and briakinumab (black). Gate within the overlay plots indicates the cells to be high expressers and non-binders to heparin or Hsp proteins