Figures & data
Table 1. Panel of antibodies used in the study. All tested antibodies were of the IgG1 backbone type. The listed mAbs are not parental to the bi- or trispecific molecules
Table 2. In vitro characterization of antibodies carrying Fc-backbone modifications. Binding affinities to the FcRn receptor of humans and cynomolgus monkeys; binding to FcγRIIIa, and pI
Table 3. Summary of PK parameters of the different antibodies tested in cynomolgus monkeys and Tg32 and Tg276 homozygous mice
Figure 1. Comparison of pharmacokinetic profiles in cynomolgus monkeys and homozygous Tg32 and Tg276 mice following administration of (a) mAb1-WT or (b) with the LS mutation; (c) tri-Ab6-WT or (d) with the LS mutation. For mouse studies, pooled plasma samples were plotted per sampling time. Abbreviations: ADA = anti-drug antibody, mAb = monoclonal antibody, tri-Ab = trispecific antibody, WT = wild type
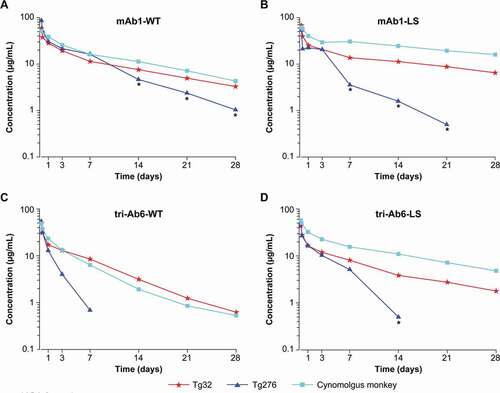
Figure 2. Comparison of pharmacokinetic profiles in (A/C) Tg32 mice and (B/D) cynomolgus monkeys. Administration of (A/B) FcRn-modulating LS and YD mutations; (C/D) mAb1 or mAb3, WT and mutated Fc backbones, Fc-silencing FcγRIIIa (NNAS). Abbreviations: mAb = monoclonal antibody, WT = wild type
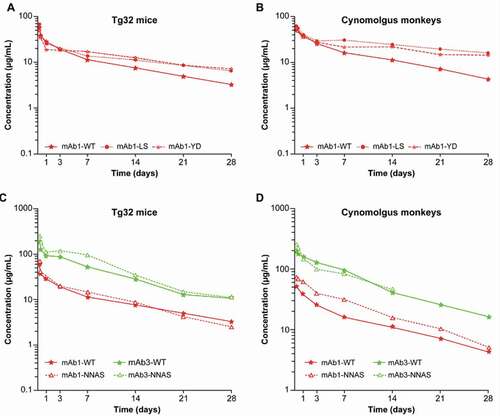
Figure 3. (a) Interspecies clearance comparison of the panel of mAbs and bi-Abs/tri-Abs tested. (b) Relationship between antibody clearance in cynomolgus monkeys/Tg32 mice and binding affinity (KD pH6) for human FcRn. Abbreviations: bi-Ab = bispecific antibody, FcRn = neonatal Fc receptor, KD = dissociation constant, mAb = monoclonal antibody, tri-Ab = trispecific antibody, WT = wild type
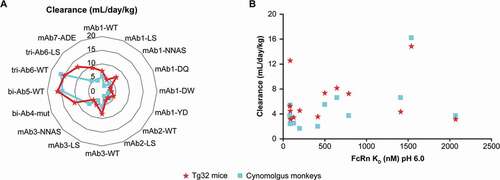
Figure 4. Correlation of antibodies’ (a) elimination half-lives and (b) clearance between homozygous Tg32 mice and cynomolgus monkeys
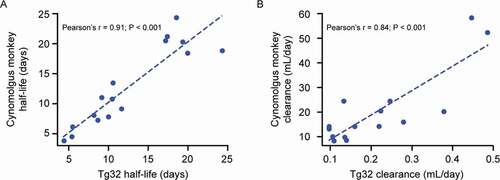
Figure 5. Estimation of α and β allometric exponents for CL and Vss, respectively, to scale from Tg32 mice to cynomolgus monkeys (NHP) using the equation YNHP = YTg32 * (body weightNHP/body weightTg32)α, β, γ. Abbreviations: bi-Ab = bispecific antibody, CL = clearance, NHP = non-human primate, tri-Ab = trispecific antibody, Vss = volume of distribution at steady state, WT = wild type, Y = variable of interest
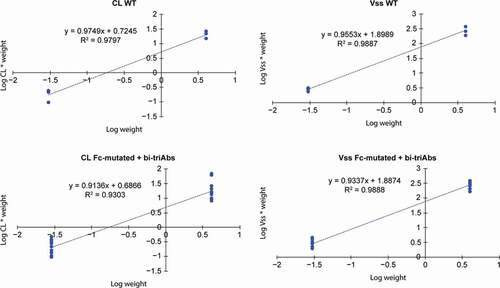
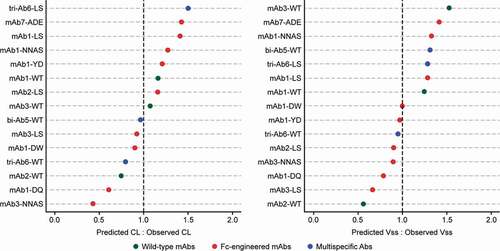
Figure 6. Ratios of predicted versus observed cynomolgus monkey Vss and CL values for the antibodies shown in Table 1. Only antibodies administered with a saturating dose to assess linear pharmacokinetics are presented; therefore, the bi-Ab4 antibody was excluded from the analysis. The predicted values were determined using the allometric equation with the α (for CL) or β (for Vss) allometric exponent estimated in Figure 5. Abbreviations: bi-Ab = bispecific antibody, CL = clearance, mAb = monoclonal antibody, tri-Ab = trispecific antibody, Vss = volume of distribution at steady state, WT = wild type