Figures & data
Figure 1. ELR+CXC chemokine sequence diversity. The sequence identity matrix heat map shows the % amino acid sequence identity between the human, cynomolgus monkey, mouse, and rat ELR+CXC chemokines. % identity ranges from ~30-90% across the chemokine family both within a given species and across species
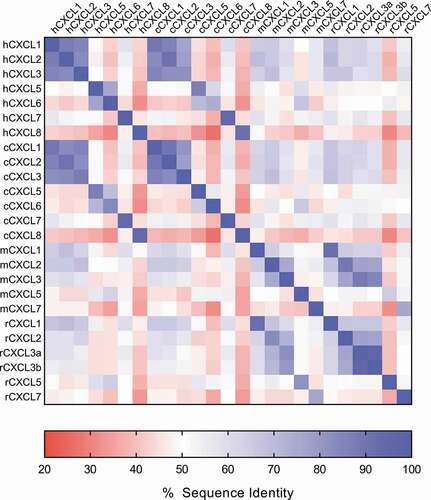
Figure 2. Optimization of developability properties from the 1581 hit to LY3041658. (a) Solubility as a function of pH (vertical labels, pH = 3.5, 5.5, 6.5, and 7.4) and ammonium sulfate concentration (horizontal labels, [(NH4)2SO4] = 0.9, 1.1, 1.3, 1.5, 1.7, and 1.9 M). Solubility was scored based on a qualitative visual scale where 1 = light precipitation, 2 = medium precipitation, and 3 = heavy precipitation. Reduced precipitation was observed for LY3041658 compared to both 1581 and the Lead antibody, indicative of improved solubility. (b) aHIC analysis demonstrated the reduced hydrophobicity (earlier retention time) of LY3041658 compared to both 1581 and to the Lead antibody. (c) Relative to the Lead antibody, LY3041658 showed decreased growth in soluble aggregate as measured by aSEC after incubation at both 5°C and 40°C for 4 weeks at 25 mg/mL
![Figure 2. Optimization of developability properties from the 1581 hit to LY3041658. (a) Solubility as a function of pH (vertical labels, pH = 3.5, 5.5, 6.5, and 7.4) and ammonium sulfate concentration (horizontal labels, [(NH4)2SO4] = 0.9, 1.1, 1.3, 1.5, 1.7, and 1.9 M). Solubility was scored based on a qualitative visual scale where 1 = light precipitation, 2 = medium precipitation, and 3 = heavy precipitation. Reduced precipitation was observed for LY3041658 compared to both 1581 and the Lead antibody, indicative of improved solubility. (b) aHIC analysis demonstrated the reduced hydrophobicity (earlier retention time) of LY3041658 compared to both 1581 and to the Lead antibody. (c) Relative to the Lead antibody, LY3041658 showed decreased growth in soluble aggregate as measured by aSEC after incubation at both 5°C and 40°C for 4 weeks at 25 mg/mL](/cms/asset/c8219431-3e77-4a14-bdce-9a047fbce683/kmab_a_1831880_f0002_oc.jpg)
Table 1. In vitro binding kinetics of LY3041658 measured by surface plasmon resonance (SPR) at 25°C. Results reported as average ± standard deviation of 2 replicates
Table 2. In vitro neutralization of 10 nM human or cynomolgus monkey chemokine-induced intracellular Ca2+ mobilization in human CXCR2 transfected HMEC-1 cells measured by FLIPR. Results reported as average ± standard deviation of indicated number of replicates. No Ca2+ mobilization response was observed for cynomolgus monkey CXCL5 or CXCL7, therefore LY3041658 neutralization activity against these chemokines could not be measured
Figure 3. In vitro CXCR2 activity and neutralization in HMEC-CXCR2 FLIPR assay. (a) Representative dose response curves for CXCL1 or CXCL8 induction of Ca2+ flux. (b) Representative dose response curves for LY3041658 neutralization of Ca2+ flux induced by10 nM chemokine (EC70, approximately). Data points are the average ± SEM of 3 replicate points. Curve fits are four parameter logistic curve fits made using GraphPad Prism 8.3
Figure 4. Binding of LY3041658 is highly specific for ELR+CXC chemokines. Data shows strong binding of LY3041658 to the human ELR+CXC chemokines coated on an ELISA plate, but not to the ELR−CXC chemokines. CXCL11 is the only ELR−CXC chemokine which shows any binding, and it is significantly weaker compared to the ELR+CXC chemokines. CXCL9 could not be analyzed due to significant nonspecific background signal. Data represent the mean ± SEM blank subtracted OD values for duplicate wells within a single ELISA plate. Curve fits are four parameter logistic curve fits made using GraphPad Prism 8.3
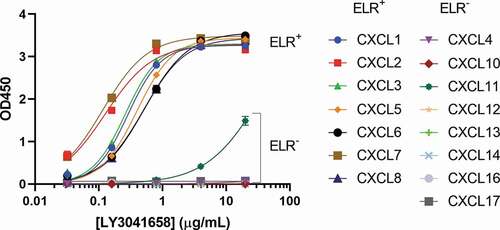
Figure 5. Alanine scanning of human CXCL8 by yeast display. (a) Expression/display of each mutant analyzed by V5+ staining. Only the K67 mutant showed poor display. (b) Relative binding was assessed by normalizing the V5+/hIgG+ population to total V5+ population. Substitution of any of the four conserved cysteines or the conserved arginine of the ELR motif effectively abolished LY3041658 binding. Several other positions with moderate loss of binding were identified: I10, Y13, F17, E38, I40, L49, and L51. In each plot, bars represent the mean ± SEM for two independent experiments
Figure 6. LY3041658/chemokine complex structure. (a) Two Fab/antigen complexes are observed in the asymmetric unit (human CXCL8 shown). The chemokines are present as homodimers with Fabs bound distal to the dimer interface. (b) The binding mode is conserved across cyno CXCL2 (blue), cyno CXCL3 (red), cyno CXCL7 (yellow), and human CXCL8 (salmon). The epitope surface is composed of the N-terminus (ELR motif and N-loop), the 30s-loop, and the β2/β3 strands
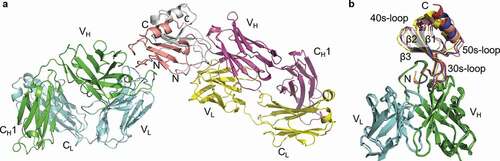
Figure 7. Detailed view of the LY3041658/hCXCL8 binding interface. (a) The Fab surface is colored by electrostatic potential using the APBS tool in PyMol 2.3 (Schrödinger, LLC) with red representing negative electrostatic potential and blue representing positive electrostatic potential (±5 kT/e scale).Citation35 A strong negative pocket shown in red binds the conserved arginine sidechain of the ELR motif, and the I10 sidechain sits in a hydrophobic pocket. (b) The R6 sidechain is anchored by a salt bridge to the HC E99 sidechain with several hydrogen bonds (dashed yellow lines) stabilizing the binding pocket. In addition to the salt bridge, cation-π interactions are observed with the R6 sidechain stacked between aromatic sidechains from both the HC and LC. (c) The paratope includes a hydrophobic pocket which accommodates I10 in hCXCL8 (shown), L12 in cCXCL2/3, and M8 in cCXCL7. (d) The HC CDR3 loop extends away from the Fab and forms a hydrophobic patch which interacts with hydrophobic residues in the N-terminus (Y13), β2 strand (I40), and β3 strand (L49) of hCXCL8. The hCXCL8 surface is colored based on residue hydrophobicity with purple representing hydrophobic residues and green representing hydrophilic residues. The color scale is normalized by consensus hydrophobicity.Citation36
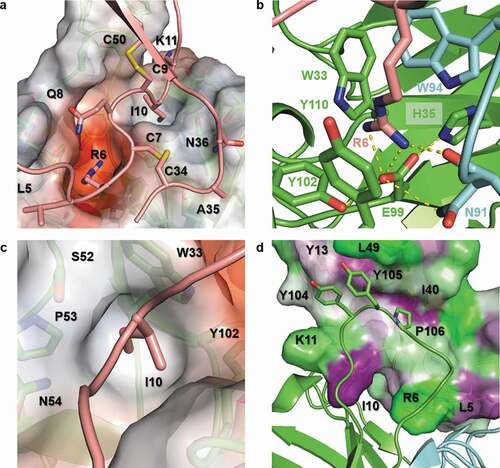
Table 3. LY3041658 SPR binding kinetics of select hCXCL8 mutants at 25°C. Results reported as average ± standard deviation of 2 replicates
Figure 8. Neutralization of hCXCL1- or hCXCL8-induced CXCR2 internalization on primary human neutrophils or neutrophil migration by LY3041658 ex vivo. (a) 20 µg/mL LY3041658 was able to block hCXCL1 (28 nM) or hCXCL8 (8.8 nM) induced internalization of CXCR2. Data shown (n = 1) is cell surface CXCR2 measured using flow cytometry expressed as Mean Fluorescence Intensity (MFI). Chemokine doses reported were equipotent in inducing CXCR2 internalization (dose response data not shown). (b) LY3041658 dose dependently neutralizes neutrophil chemotaxis induced by either hCXCL1 (5.1 nM) or hCXCL8 (10 nM). Chemokine doses were selected to be equipotent in inducing chemotaxis as measured by fluorescence of the CellTracker Green dye. Fluorescence values (485 nm/535 nm ex/em) are plotted as the blank subtracted mean ± SEM of triplicate test wells. Curve fits are four parameter logistic fits made with GraphPad Prism 8.3
Figure 9. In vivo neutralizing activity of LY3041658. LY3041658 dose dependently reduced neutrophilia in mice induced by either hCXCL8 (a) or hG-CSF (b). The %neutrophils in blood was measured by flow cytometry as CD11b+/Ly6G+ cells normalized to total number of cells analyzed. Bars represent the mean ± SEM for n = 6 animals. Statistical analysis was done with GraphPad Prism 8 using one-way ANOVA with multiple comparisons to the isotype control (Dunnett’s test). Significant differences relative to isotype control are displayed: *** = 0.0001 ≤ p < .001, **** = p < .0001