Figures & data
Figure 1. Interactions modeled for AlbudAb GSK3128349 PBPK. ALB: endogenous albumin at constant concentration. AlbudAb in unlabeled or 89Zr-complexed format. Zr denotes both free label as well as 89Zr-AlbudAb which has lost affinity for albumin. Solid arrows denote reversible binding of AlbudAb to albumin. Dashed arrow is a combined reaction which denotes irreversible loss of 89Zr from the chelate or inactivation of the AlbudAb. Detailed reaction scheme for all molecular species and which includes vascular, interstitial, and endosomal compartments is shown on Supplementary Figure 1
Figure 2. Structure of the whole body PBPK. (A) The organs are connected with plasma flow rate (Qorg, black line) and lymph flow rate (Jorg, gray line). Abbreviations: lung-lu, lymph nodes -ln, heart-he, GI tract-gi, liver-li, spleen-sp, pancreas-pa, skeletal muscle-mu, skin-sk, bone-bo, brain-br, thymus-th, adipose-ad, other-ot, kidney-ki. The organ subcompartments are vascular (v), interstitial (i), intracellular (IC) and endosomal (e). (B) Filtration-diffusion-driven solute exchange between the vascular and interstitial spaces takes place through small and large pores according to the two-pore hypothesis. Macropinocytosis (kup) delivers extracellular proteins to the endosomal space where FcRn-mediated recycling (krec) back into vascular or interstitial space and nonspecific degradation (kdeg) take place. Organ-specific modifications are shown on Supplementary Figure 2
Table 1. Parameters used for human AlbudAb-specific PBPK model
Figure 3. The tissue distribution time course results before and after fitting for kidneys (a) and the brain (b). Red: total 89Zr-containing species in plasma, black-tissue average of total 89Zr, blue-predicted interstitial concentration. Solid line-fitted model, dashed line-default model. Solid and dashed lines overlay for the capillary plasma compartment in both organs and for the interstitial compartment in kidneys
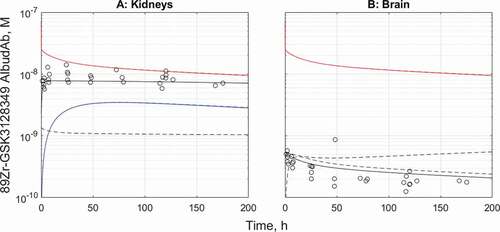
Table 2. Fitted parameters
Figure 4. Plasma half-life dataCitation14 and best fit for 89Zr-GSK3128349 AlbudAb in healthy humans. AlbudAb plasma concentration: Blue: measured by mass spectrometry for AlbudAb protein, Red: measured by scintillation and PET for 89Zr. Solid line-fitted model, dashed line-default model
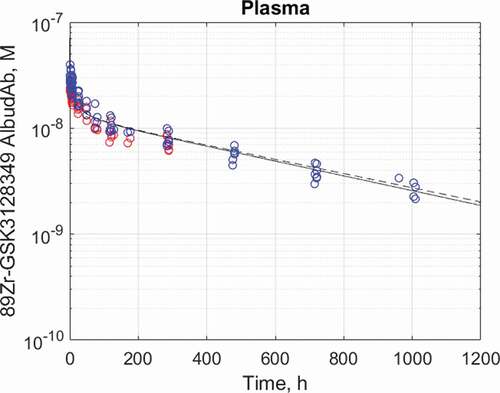
Figure 5. Observed and predicted tissue and interstitial concentrations for muscle (a), lungs (b), liver (c), bone marrow (d), pancreas (e), and spleen (f). The default model predictions are in dashed lines while the kidney- and brain-adjusted predictions are in solid lines. The solid and dashed lines overlap for all organs. Black: total tissue concentration, red: vascular concentration, blue: interstitial concentration
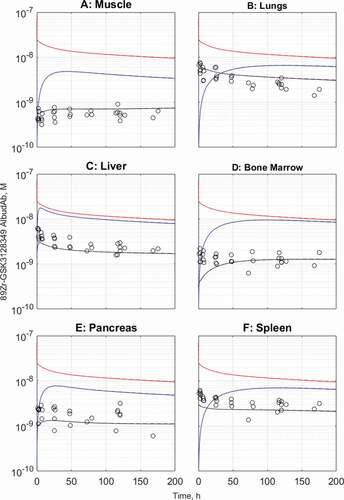
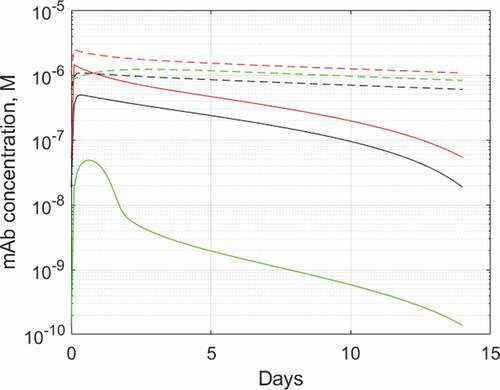
Figure 6. Predicted plasma and tissue interstitial concentrations of ibalizumab during a steady state 800 mg Q2W dosing. Solid lines: ibalizumab, dashed lines: hypothetical isotope control mAb with 20-day half-life and linear pharmacokinetics. Red: plasma, black: lymph node interstitium, green: spleen interstitium. The PBPK model used and parameterization is described in Supplementary Section