Figures & data
Figure 1. (a) Schematic design of the pMHCI-IgG (top) and the TCB fusion proteins (bottom). Both formats consist of a full monoclonal antibody in an IgG format (light green: antibody light chain, dark green: antibody heavy chain variable domain and CH1, gray/black: constant domain of the antibody heavy chain in the knob and hole format or with charge mutations to drive heterodimerization). A single pMHCI complex consisting of the antigenic peptide (magenta), MHC class I heavy chain lacking the transmembrane domain (purple) and beta-2-microglobulin (blue) or a single anti-CD3 binding CrossMab Fab (crossed heavy and light chain in yellow and red) are fused to one of the antibody heavy chains. (b) Frequency of IFN-γ expressing CD8 T cells measured in flow cytometry after exposure to compound-treated target cells. Incubation of MC38-FAP tumor cells loaded with MCMV-derived M38 peptide (blue), T cell bispecific TCB-αFAP (green), pMHCI-IgG M38-αFAP (red) or pMHCI-IgG IE3-αFAP (pink) and unloaded tumor cells (cyan) with splenocytes from M38 vaccinated mice. Splenocytes were isolated nine days after start of vaccination. All graphs show mean of replicates (n = 2) with error bars indicating standard deviation. (c) Specific tumor cell lysis mediated by compounds after incubation with splenocytes from M38 vaccinated mice. Number of viable cells is measured with xCELLigence as electrical impedance mediated by adherent cells on the culture dish bottom. Color code: IE3-αFAP (purple), M38 peptide (blue), TCB-αFAP (green), M38-αFAP (red). Kinetics of cell lysis at a compound concentration of 25 nM is shown (left). Tumor cell elimination after 40 hours is shown for all concentrations tested (right). All graphs show mean of replicates (n = 3) with error bars indicating standard deviation. Two-sided t-test for significance evaluation was applied. P-values from 0.01 to 0.05 were considered as significant (*), p-values from 0.001 to < 0.01 were considered as very significant (**) and p-values < 0.001 were considered as extremely significant (***). (d) Relative expression of endogenous MHC class I compared to pMHCI-IgG delivered recombinant MHC class I. FAP expressing B16 and MC38 tumor cells were loaded with Ova257-264 peptide (light green) or pMHCI-IgG Ova257-264-αFAP (dark green) and SIINFEKL peptide-MHC class I complexes were detected with the monoclonal antibody anti-Ova257-264 – mouse H-2Kb antibody (25-D1.16) in flow cytometry
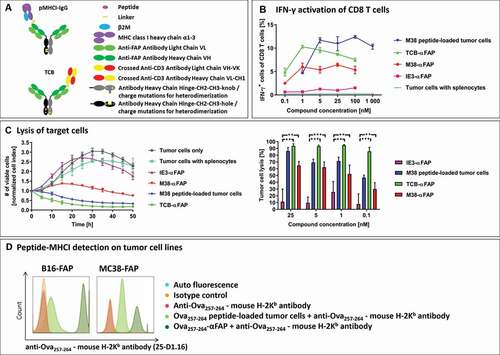
Figure 2. Experimental lung metastasis model
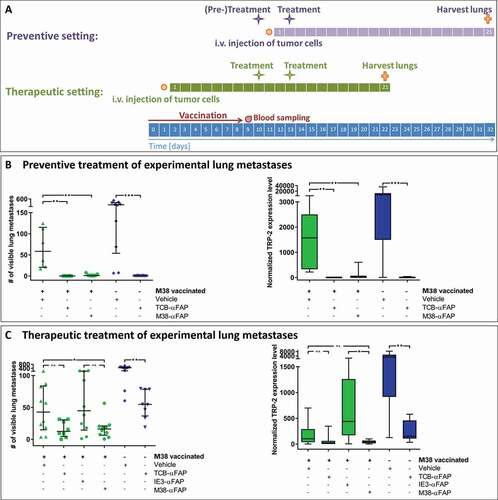
Figure 3. Bright field and immunofluorescent staining of lungs containing metastases derived from either murine FAP-transfected (right) or non-transfected (left) B16 melanoma cells at day 21 after injection of tumor cells. Pigmented B16 cells can be recognized in the bright field (top row). Murine FAP in cyan blue, cell nuclei in blue (DAPI). In the top row cut ends of cryo-section tissue blocks are depicted so that metastases can be localized in the corresponding stained cryo-sections below (middle row). The close-up images (bottom row) show normal lung tissue and parts of metastases. Red arrows indicate borders of metastases
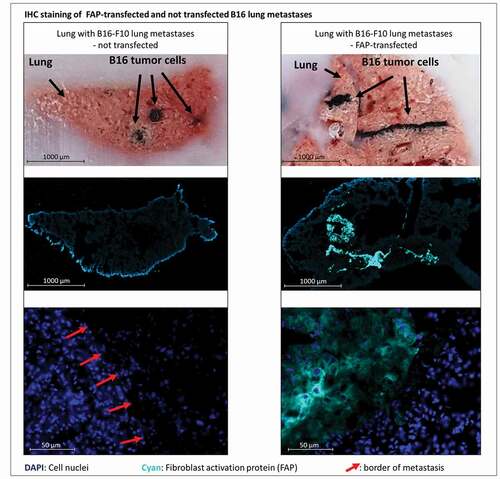
Figure 4. Solid tumor model
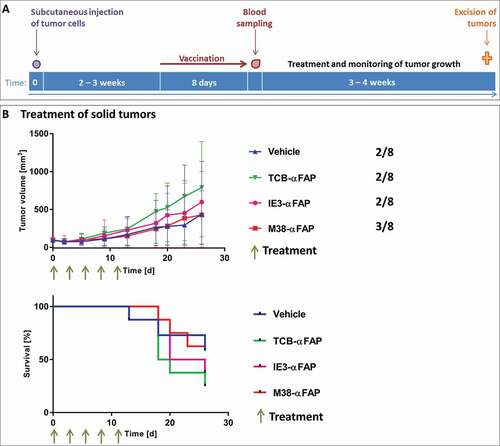
Figure 5. Immunofluorescent staining of murine FAP in solid tumors derived from either murine FAP-transfected (upper right, lower left, lower right) or non-transfected (upper left) MC38 colorectal cancer cells. Murine FAP-transfected tumors were treated with the TCB (lower left), the pMHCI-IgG (lower right) or untreated (upper right). Cell nuclei are stained with DAPI and depicted in blue. Murine FAP located on the cell surface is depicted in cyan blue
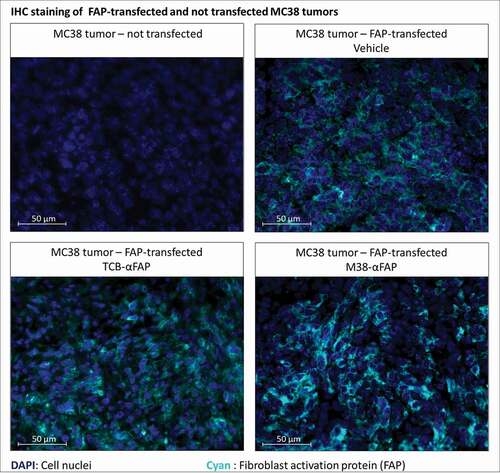
Figure 6. Tumor penetration and accumulation of pMHCI-IgG molecules
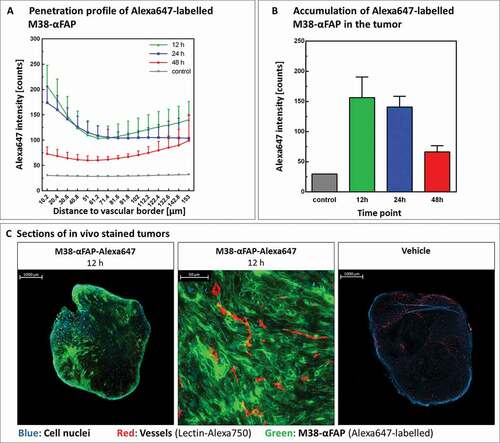
Figure 7. CD8 T cell infiltration in solid MC38-FAP tumors after a single treatment with compounds
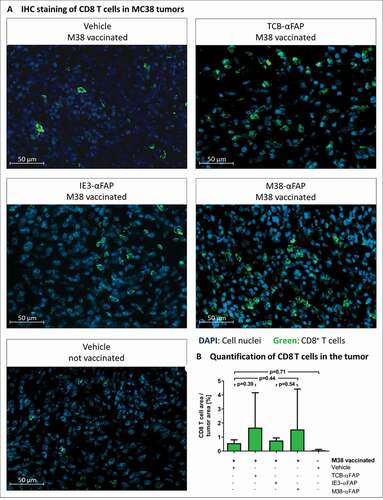
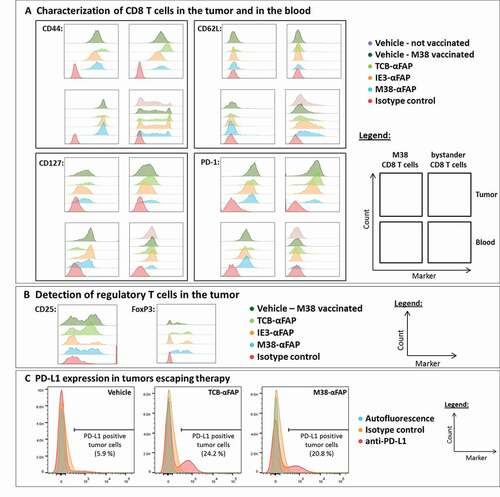
Figure 8. Flow cytometry analysis of T cells and tumor cells from M38 vaccinated and pMHCI-IgG or TCB-treated mice