
Figures & data
Figure 1. Characterization of antibodies against the human spliced isoform D of Tenascin C (hTNC-D)
(a) Structural model of one subunit of Tenascin C. Structural domains: hexagon, Tenascin assembly domain; ellipses, epidermal growth factor (EGF) like repeats; white squares, constant fibronectin type 3 homology repeats; gray squares, alternatively spliced fibronectin type 3 homology repeats; circle, fibrinogen globe. Schematic representation of phage display. Characterization of L7D and R6N scFv selected from ETH-2 library; (b, g) SDS-PAGE, 10% gel in reducing (R) and non-reducing (NR) condition of purified scFvs; (c, h) Size exclusion chromatogram, the major peak eluting at about 11.5 mL corresponds to the molecular weight of monomeric fraction of scFvs; (d, i) BIAcore sensograms of monomeric scFvs on hTNC-D coated CM5 chip; (e, l) BIAcore sensograms of scFvs on mouse TNC-BCD domains coated CM5 chip; (f, m) Microscopic fluorescence analysis of TNC-D on U87 tumor section detected with scFvs (green, AlexaFluor 488) and anti-CD31 (red, AlexaFluor 594). Cell nuclei were counterstained with DAPI (blue). Representative pictures of the samples were taken 20x magnification, scale bars = 100 µM.
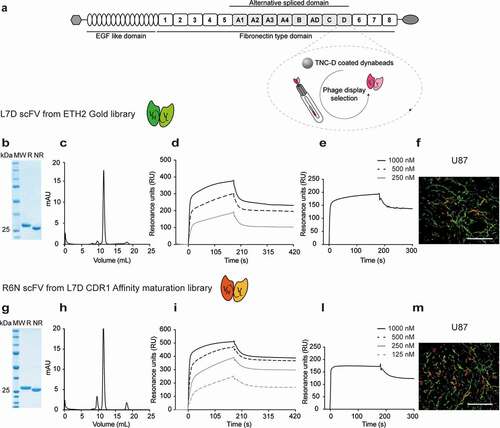
Figure 2. Microscopic fluorescence analysis of TNC-D expression on xenografts and tumors of mouse origin section with R6N IgG1-FITC
(a) Microscopic fluorescence analysis of human TNC-D expression on xenograft tumor: SKRC52, U87, A431 and A375 detected with R6N-IgG1-FITC and KSF IgG1-FITC (negative control); (b) Microscopic fluorescence analysis of mouse TNC-D expression on tumors of mouse origin: Colon 26, C51, SMA-497 and SMA540 detected with R6N IgG1-FITC and KSF IgG1-FITC (negative control). Cryosections were stained with anti-FITC (green, AlexaFluor 488); cell nuclei were stained with DAPI (blue). Representative pictures of the samples were taken at 10x magnification, scale bars = 100 µM.
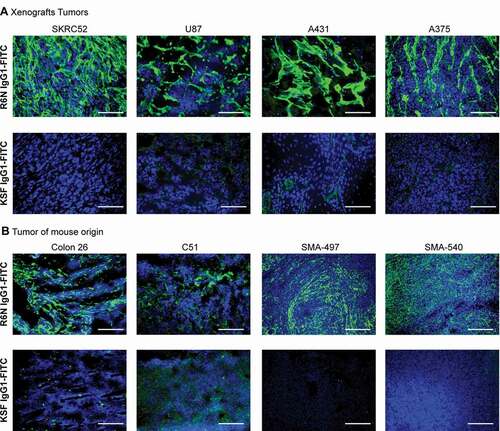
Figure 3. Microscopic fluorescence analysis of TNC-D expression of frozen tumor and normal tissues
A tissue microarray containing normal tissue specimens (left) and their tumoral counterpart (right) was stained with R6N IgG1-FITC (green, AlexaFluor 488); cell nuclei were stained with DAPI (blue). Representative pictures of the samples were taken at 10x magnification, scale bars = 100 µM.
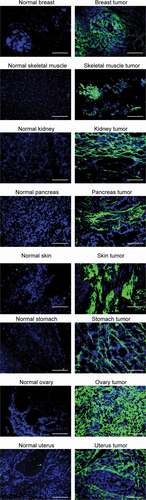
Figure 4. Immunofluorescence-based biodistribution analysis with R6N IgG1
Microscopic fluorescence analysis of tumor-targeting performance on A375 (a) and A431 (b) tumor and organs from BALB/c nude tumor-bearing mice. Two hundred micrograms of R6N IgG1 or KSF IgG1 (negative control) was injected intravenously into the lateral tail vein and mice were sacrificed 24 hours after injection, tumor and organs were excised and embedded in cryoembedding medium; cryostat sections were stained with Protein A (green, AlexaFluor 488) and DAPI (blue). Representative pictures of the samples were taken at 20x magnification, scale bars = 100 µM
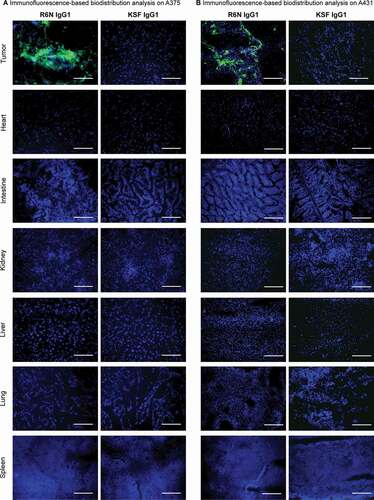
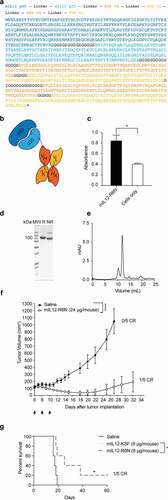
Figure 5. Therapy in BALB/c nude mice bearing SKRC52 human renal cell carcinoma and in VM/Dk mice bearing SMA-497 glioma
(a) Amino acid sequence of mIL12-R6N in tandem diabody format. Starting from the N-terminus: mIL12 and R6N in tandem diabody format; (b) Scheme of the heterodimeric murine IL12 fused to the R6N antibody in tandem diabody format; (c) IFN-γ induction assay by mIL12-R6N in BALB/c lymph nodes confirmed the activity of mIL12 at a concentration of 0.1 ng/mL. The experiment was done in triplicates; (d) SDS-PAGE, 10% gel in reducing (R) and non-reducing (NR) condition of purified mIL12-R6N; (e) Size-exclusion chromatogram, the major peak eluting at 12.16 mL corresponds to the molecular weight of monomeric fraction of mIL12-R6N. (f) Therapeutic performance of mIL12-R6N in BALB/c nude mice bearing SKRC52 human renal cell carcinoma. Data represent mean tumor volume ± SEM, n = 5 mice per group; CR, complete response. Treatment started when tumors reached a volume of 100 mm3, mice were injected three times intravenously every 48 hours with 24 µg of either mIL12-R6N or PBS. (g) Therapeutic performance of mIL12-R6N and mIL12-KSF in VM/Dk mice bearing SMA-497 glioma. Mice were injected treated intravenously at days 5 and 10 after tumor implantation with 8 µg mIL12-R6N or 8 µg mIL12-KSF or PBS. Survival rate is presented as Kaplan–Meier plots, n = 5 mice per group.
Supplemental material