Figures & data
Figure 1. Binding of mAb757 to immobilized ligands and cells. A-C: mAb757 was bound to protein G-coated sensor chips and binding of I-Ag7/p8E (a), I-Ag7/p8G (b), or I-Ag7-HEL (c), measured by bio-layer interferometry. Results shown are representative of 3 independent experiments. D, E: Immortalized “type A” or “type B” T cells were incubated with cognate tetramers in the presence or absence of mAb757 and analyzed by flow cytometry. Plots show profiles in the absence of tetramer (red), tetramer alone (blue), or tetramer + 2 μg (orange), 5 μg (light green), or 10 μg (dark green) mAb757. One of 3 independent replicates is shown. D. PCR1-10 + p8G; E. BDC12-4.4 + p8G
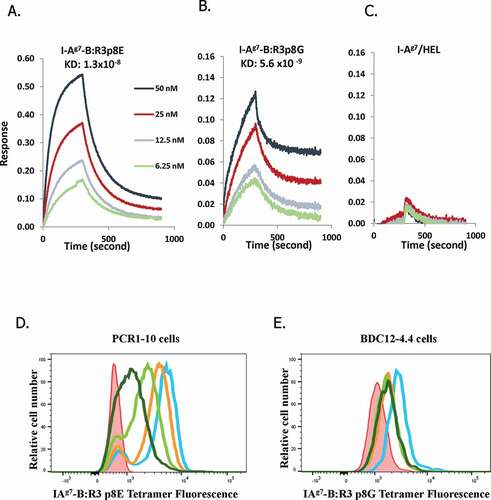
Figure 2. Binding characteristics of mAb757 A. ELISA plates were coated with 2 µg/ml human insulin, or the B:9–23 wt, R3:p8E, R3:p8G, or TT peptides (Table S1). After washing and blocking steps, specific binding of test and control antibodies was determined.Citation18 Binding to mAb757 (black bars), mAb287 (checkered bars; negative control), or AIP-46.12 (open bars; positive control) is shown. B: ELISA plates were coated with 1 µg/ml mAb757 (filled bars), mAb287 (checkered bars) or 10–3.6 (positive control; open bars). After washing and blocking steps, specific binding of biotinylated I-Ag7-B:R1, I-Ag7-B:R2, or I- Ag7-B:R3 complexes was measured by ELISA.Citation18 Data is the mean ±SD of 3 replicates
Figure 3. Effect of mAb757 on T cell activation. Fixed M12(C3):I-Ag7 APCs were incubated with agonist peptides as described in Methods, then co-cultured overnight with T cell lines and mAb287 (black squares) or mAb757 (orange triangles). Secreted IL-2 was measured by ELISA. Graphs show the percent of the response in the absence of antibody and are the mean of 3 independent experiments. A: I-29 + R3:p8E (100 µg/ml); B: PCR 1–10 + R3:p8E (10 µg/ml); C: BDC8-1.1 + R3:p8G (10 µg/ml); D: AS91 + R3:p8G (10 µg/ml); E: BDC-2.5 + HRPI (1 µg/ml); F: 5F2 + HEL (1 µg/ml). *p < .05 analyzed by student-t test
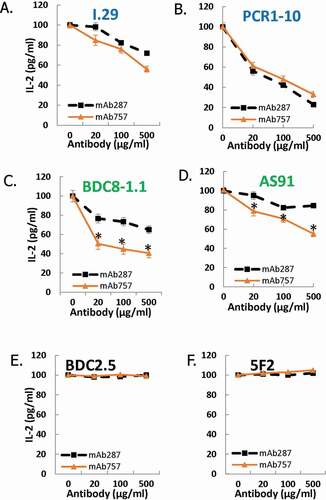
Figure 4. Binding of mAb757 to APCs ex vivo. Draining popliteal lymph node cells were harvested after peptide immunization and analyzed by flow cytometry as described in Methods. Profiles show binding of mAb757 (open profiles) or control 15G1a (filled gray profiles) to A: B lymphocytes, B: Dendritic cells, C: T cells. Cells were gated on CD19+ cells, CD11c+ cells and CD4+ cells, respectively
Figure 5. Effect of mAb757 on T1D incidence after early intervention. Groups of 4–5-week-old female NOD mice were treated with antibodies or saline as described in Methods and monitored for up to 35 weeks of age. A: Effect of low (100 µg) dose therapy with IgG1 variants. Graphs show treatment with mAb757 (blue circles; n = 19), mAb287 (green triangles; n = 18), isotype control (red squares; n = 32), or saline control (black open circles; n = 22). B: Comparison of low (100 µg) and high (500 µg) doses of mAb757 isotype variants. Graphs show treatment with mAb757-IgG1-low (blue circles; n = 19); mAb757-IgG2c-low (purple triangles; n = 18), IgG2c isotype control-low (purple triangles; n = 13), mAb757-IgG2c-high (purple stars; n = 20), IgG2c isotype control-high (black filled circles; n = 13), IgG1 isotype control-low (n = 32; red squares), or saline control (black open circles; n = 22). Statistically significant variation between groups was determined using a Mantel-Cox test. C: The percentage of insulin positive islets from surviving mAb757-treated animals at 35 weeks or diabetic control-treated mice after diagnosis was measured by immunohistochemistry. Data show average results from all islets from each individual mouse. Asterisks indicate p < .001 relative to diabetic animals
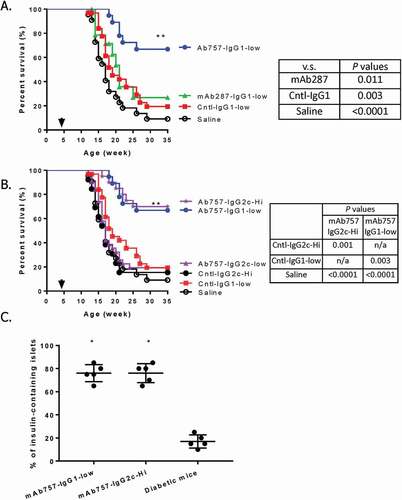
Figure 6. Histological analysis of islets from pre-diabetic mice. Groups of mice (n = 6) from the early prevention trial were sacrificed 4 weeks after the initiation of therapy. Pancreata were harvested and serial sections stained with hematoxylin & eosin. Insulitis was scored based on established criteria (Fig. S5) by a blinded pathologist. Mean scores for mice in the mAb757-IgG1-low (circles) and IgG1 isotype control-low (squares) groups are shown. Statistically significant differences were identified using an unpaired student t test. ** p = .003; *p = .026
Figure 7. Effect of mAb757 on T1D incidence after intervention late in pre-diabetes. Groups of 9-week-old female NOD mice were treated with antibodies or saline as described in Methods and monitored for up to 35 weeks of age. Graphs show treatment with mAb757-IgG2c-high (purple stars; n = 19), mAb757-IgG1-low (blue circles; n = 19), IgG1 isotype control-low (green triangles; n = 38), IgG2c isotype control-high (black filled circles; n = 13), or saline (orange diamonds; n = 16). The proportions of animals remaining diabetes-free in each group are shown. Statistically significant variation between groups was determined using a Mantel-Cox test. Double asterisk shows p = .005 vs. IgG2c isotype control-high
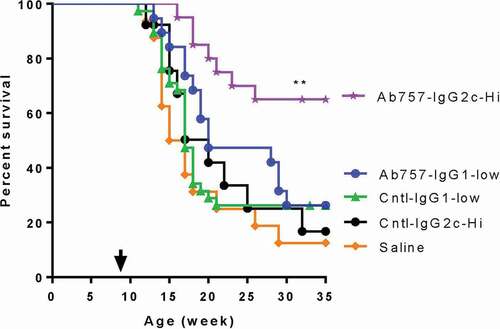
Figure 8. Effect of mAb757 on recurrence of hyperglycemia after intervention post-onset. Newly diabetic female NOD mice with blood glucose levels between 250–400 mg/dL at baseline were randomly assigned to a treatment group, implanted with a sustained-release insulin pellet to restore normoglycemia, then treated with antibodies as described in Methods, and monitored for up to 25 additional weeks. Animals in the two IgG1 groups received 200 µg/injection, animals in the two IgG2c groups received 1 mg/injection. The number of days before overt hyperglycemia recurred is shown for each group: IgG1 isotype control (upright triangles, n = 9), IgG2c isotype control (inverted triangles, n = 7), mAb757-IgG1 (squares, n = 11), mAb757-IgG2c (circles, n = 8)