Figures & data
Table 1. Summary of isolated clone sequences. Analysis of SHM, CDR charge, and length, was performed on all 195 light and heavy chains. Characterization of WHEP binding was as determined by the initial screening paradigm outlined in
Figure 1. Assay format used for single-cell antibody discovery. A two-step screening assay was performed. In step 1, antibody-secreting cells were co-incubated with protein A beads to capture secreted antibodies and were detected using fluorescently labeled WHEP domain-MBP and WHEP domain-deleted HARS (left). In step 2, fluorescently labeled full-length HARS was added to confirm binding to the full-length protein (right). The two phenotypes observed during screening are depicted in the schematic: specificity to the WHEP domain (top panel, Phenotype 1) and specificity outside the WHEP domain of HARS (bottom panel, Phenotype 2)
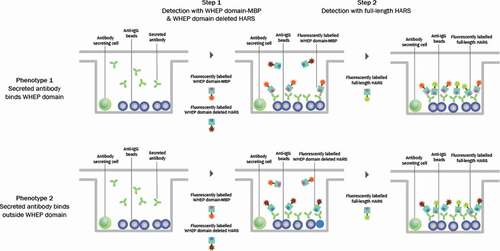
Figure 2. Frequency and pairing of V and J genes within single cell (b) and repertoire (a) heavy chains. V genes are shown on the left and J genes are shown on the right of each diagram. V/J pairing is represented by a horizontal-colored line joining the respective V and J gene. Single-cell data was collapsed to unique chains. (A) V/J gene frequency and pairing in repertoire heavy chains from Donor 1, including both self-reactive, and non-self-reactive clones. (B) V/J gene frequency and pairing in heavy chains from recovered self-reactive single-cell clones from Donor 1
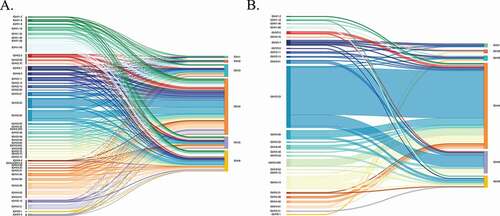
Figure 3. Comparison of heavy chain features from single cells, collapsed to unique sequences, to 5887 unique sequences recovered in the repertoire. Significance between Donor 1 repertoire and Donor 1 single cells calculated by Kolmogorov Smirnov test. * = p < .05, ** = p < .005, ns = not significant. Comparison of: (a) nucleotide SHM, (b) heavy chain CDR3 length, (c) heavy chain positive residues per CDR3 (lysine and arginine), (d) heavy chain negative residues per CDR3 (glutamate and aspartate)
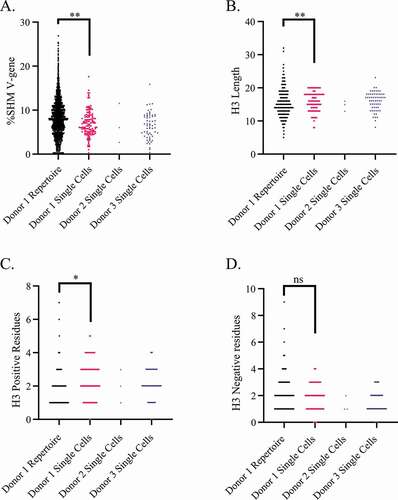
Figure 4. (a) Alignment of Ab14 and Ab92 heavy chain V region to germline sequences IGHV3-11*06 and IGHJ4*02. Identities are represented as dots, SHM substitutions are shown. V(D)J junction represented as Xs. (b) Alignment of Ab14 and Ab92 light chain V region to germline IGKV1D-12*01 and IGKJ2*01
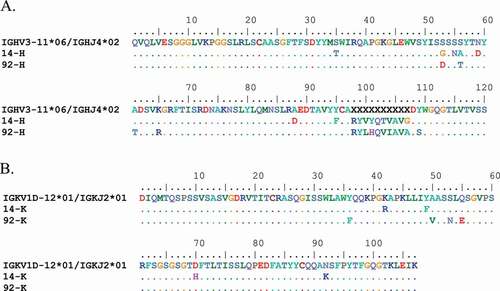
Figure 5. Affinity of parent antibodies to recombinant dimeric HARS(aa1-506) at 150, 50, 16.67, 5.56, and 1.85 nM, fit to bivalent analyte model. Fit lines are displayed in red, experimental data in gray scale. Representative SPR trace of: (a) Ab92, (b) Ab14, (c) Ab92 with H97Y mutation sourced from Ab14, (d) Ab14 with T99V mutation sourced from Ab92. (e) Table of kinetic constants. (f) Summary table of sites of SHM in Ab14 and resulting affinities when transferred to Ab92. Mutations numbered according to Kabat numbering scheme
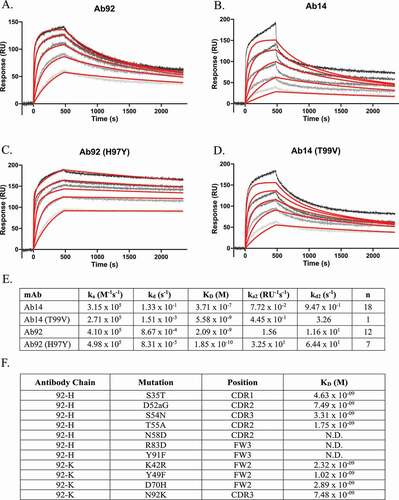
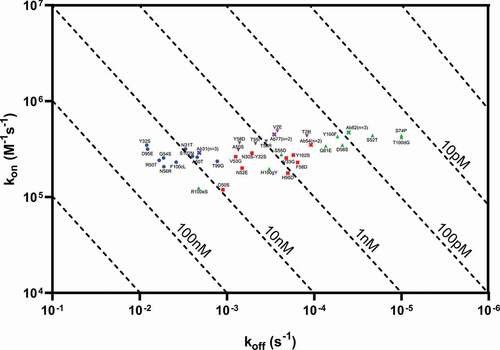
Figure 6. Iso-affinity plot of SHM variants tested for four selected antibodies: Ab31, Ab54, Ab62 and Ab77. Indicated affinities to recombinant dimeric HARS(aa1-506) at 150, 50, 16.67, 5.56, and 1.85 nM, fit to bivalent analyte model. Parent antibodies are displayed as colored crosses, while individual mutants are shown as colored blue circles (Ab31 variants), red squares (Ab54 variants), up green arrows (Ab62 variants) and down purple arrows (Ab77 variants)