Figures & data
Figure 1. Position of the DE loop in antibody structures
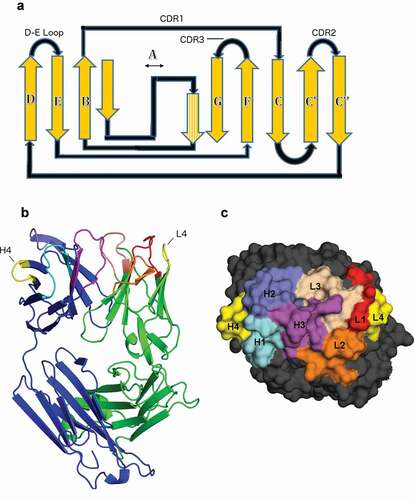
Table 1. Map between various numbering schemes within H4 and L4 loops
Figure 2. Ramachandran plots for part of the D strand, the DE loop, and part of the E strand (IMGT residues 77–90) for the most common DE loop lengths
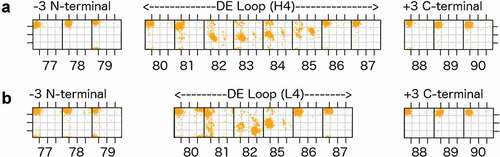
Table 2. DE loop canonical families
Figure 3. Canonical conformations of L4 and H4
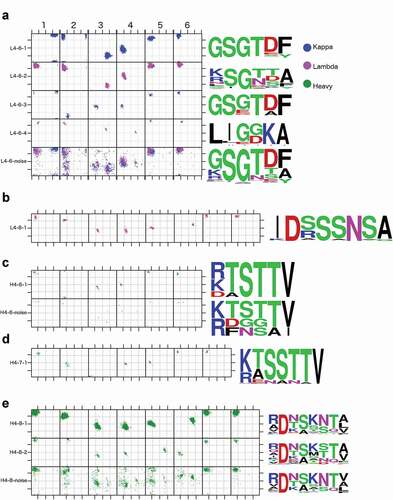
Figure 4. Structures of all DE loop germline-length clusters
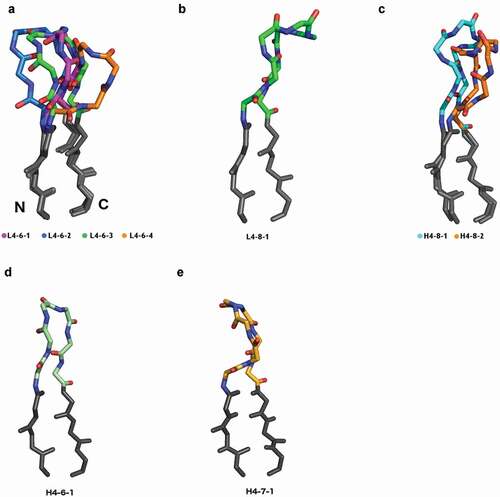
Figure 5. Comparison of H4 and L4 clusters with structural homology
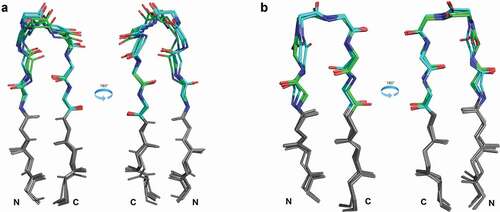
Table 3. Co-occurrence of L1/L4 pairs from structures in the PDB
Figure 6. Various characteristic hydrogen bonds between the DE loop and CDR1. Hydrogen bonds are labeled CDR4.resnumAtom/CDRn-cluster.resnumAtom (e.g. H4.6O/H1-13-1.2N). If a hydrogen bond is specific to a particular cluster, that is included in the nomenclature
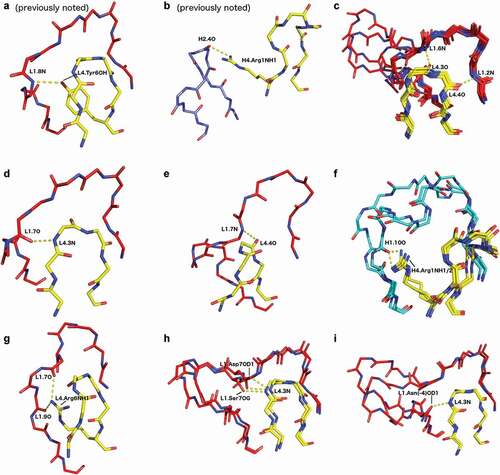
Figure 7. Sequence entropy in naïve human antibodies and human germlines
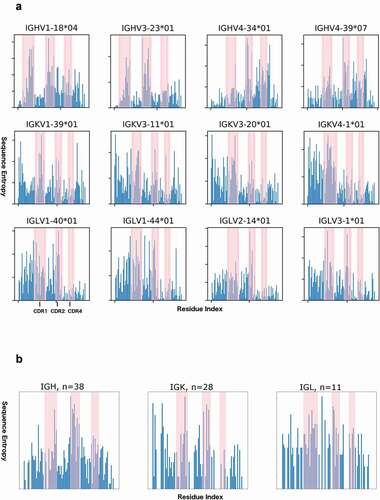
Table 4. Average sequence entropies for CDR and framework regions
Table 5. HIV-1 bNAbs with insertions in L4 and/or H4
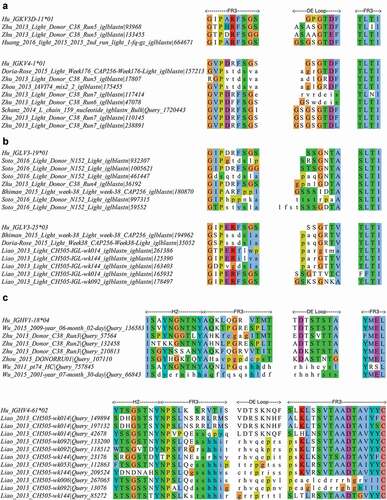
Figure 8. Alignment of a subset of gp120 binding HIV-1 bNAbs representing all unique DE loop sequences
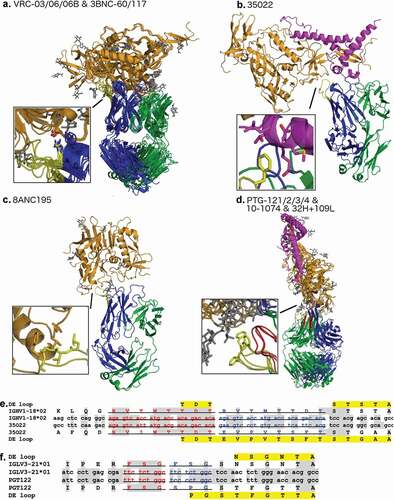
Figure 9. Buried surface area for each CDR at the antibody-antigen interface of HIV-1 bNAbs that bind to gp120 in the PDB
Figure 10. DE loop and DE loop adjacent insertions from a large antibody sequencing data set from HIV-infected individuals