Figures & data
Figure 1. Glycan profiles of mAb1 by UPLC (a); inset shows enlarged figure. (b) Structures of glycans; asterisks indicate galactose-alpha-1,3-galactose linkages (b). G, galactose; GN, N-acetyl-glucosamine; M, mannose; f, fucose; NGc, N-glycolylneuraminic acid
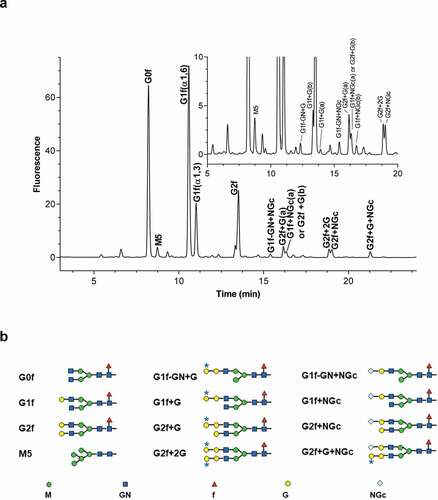
Figure 2. Purification scheme for mAb1 from human serum
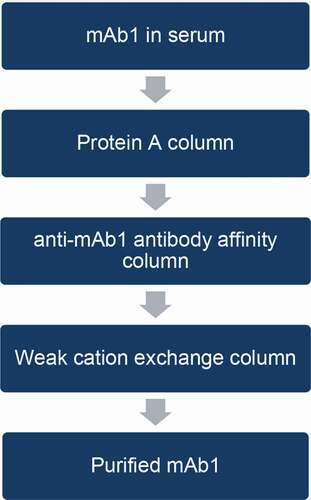
Figure 3. Comparison of UPLC glycan profiles. (a) mAb1; (b) human serum; (c) mAb1 from human serum purified only by protein A and immobilized anti-mAb1 affinity columns; (d) mAb1 from human serum purified by protein A, immobilized anti-mAb1 affinity, and WCX columns. Arrows in (c) indicate glycan species present in serum proteins, which may interfere with mAb1 glycan profiles. After two-step purification, the interference peaks from serum proteins were not completely removed (c), and major glycan species of mAb1 co-eluted with glycans from serum. The peak marked with an asterisk (c, d) showed a specific glycan peak observed only in serum glycoproteins and used to confirm purification efficiency. After three-step purification, this major serum glycan interference was significantly reduced (d), and both glycan profiles before (a) after (d) were comparable
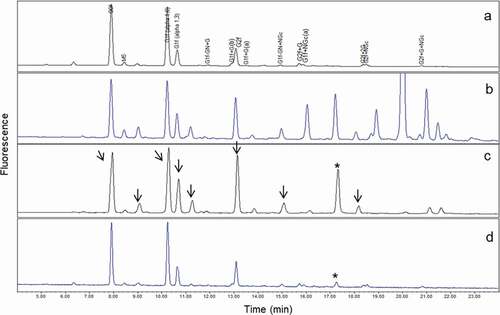
Figure 4. Comparison of glycan profiles. (a) mAb1 without purification; (b) mAb1 purified from PBS buffer with three-step purification; and (c) mAb1 purified from serum with three-step purification. Overlay of three profiles demonstrated that interference by serum glycoproteins in mAb1 glycan profile was negligible after three-step purification
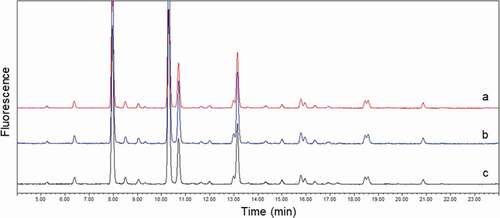
Figure 5. Comparison of WCX chromatograms (a) and glycan profiles (b) among non-purified mAb1 and degraded mAb1 stressed at 25℃ or 40℃ for 3 months and spiked in and purified from serum
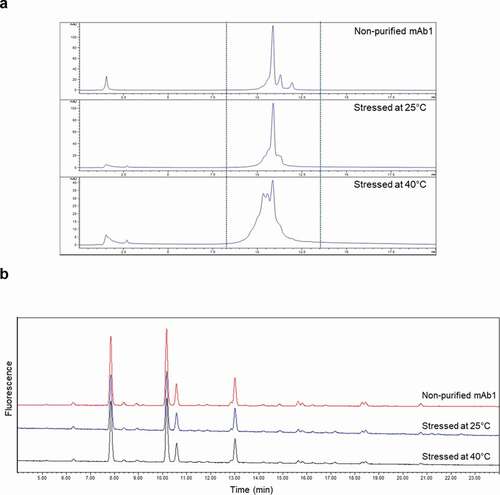
Table 1. Glycan analysis of degraded mAb1
Table 2. Recovered mAb1 from three-step purification process
Figure 6. Overlay of glycan profiles of purified mAb1 from clinical study patient. (a) patient 1 at T0; (b) patient 1 at TF. No significant differences were observed between two samples, especially for minor glycan species
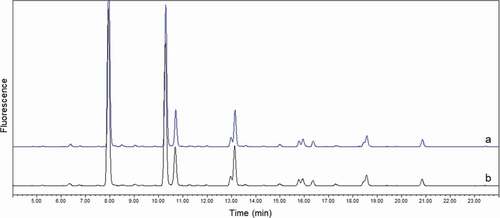
Table 3. Glycan analysis of mAb1 purified from 14 clinical sera
Figure 7. Comparison of major glycans (G0f, G1f, G2f) between T0 and TF. T0 (black): samples taken from patients after receiving final dose on d 337; TF (gray) samples taken from patients on d 365 (4 weeks of final dose)
Figure 8. Comparison of Gal-α-Gal and NGNA between T0 and TF. T0 (black): samples taken from patients after receiving final dose on d 337; TF (gray) samples taken from patients on d 365 (4 weeks of final dose)
Figure 9. Changes in levels of Mannose 5 between T0 and TF. T0 (black): samples taken from patients after receiving final dose on d 337; TF (gray) samples taken from patients on d 365 (4 weeks of final dose)