Figures & data
Figure 1. Immunoreactivity of mAb 2C5. Indirect ELISA was used to evaluate the binding of 2C5 antibody to a monolayer of different antigens: (a) HL-60 produced NETs and nucleohistones, (b) neutrophils produced NETs and nucleohistones. The affinity for both substrates is similar, indicating 2C5 has specific activity against NETs, as well as for nucleosomes. Detection was done using a horseradish peroxidase (HRP)-conjugated secondary antibody. Data represents the mean ± SD, n = 3
Figure 2. mAb 2C5 binding to NETs in vitro. (a) Neutrophils were isolated from whole blood and stimulated with either PMA or CI, followed by staining with 2C5 antibodies (red) and counterstaining using Hoechst (blue). Activated neutrophils produced NETs, confirmed by the presence of web-like structures and filamentous structures comprised of decondensed DNA (arrows). These structures were also labeled with 2C5, to show the specificity of this antibody against NETs, presenting an overlap with the DNA staining (magenta). (b) Pearson’s correlation coefficient was analyzed using Image-J and indicates good correlation of pixel intensity distribution between red and blue channels in PMA and CI treated groups. The image brightness and contrast of the 2C5 channel were adjusted using the B&C tool of Image-J Software to improve visualization, especially in the overlay images. Equal adjustments were applied to images that were obtained at the same day and using the same microscope parameters. Scale bar = 50 µm
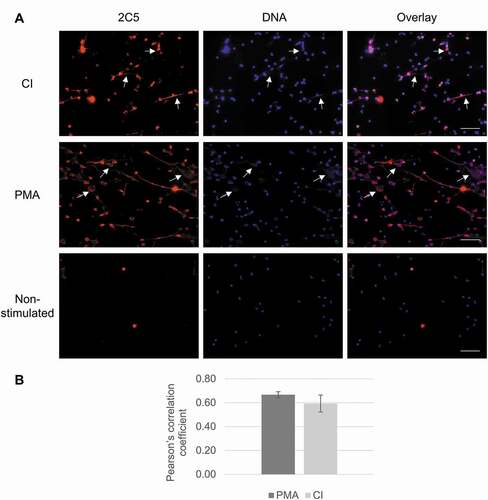
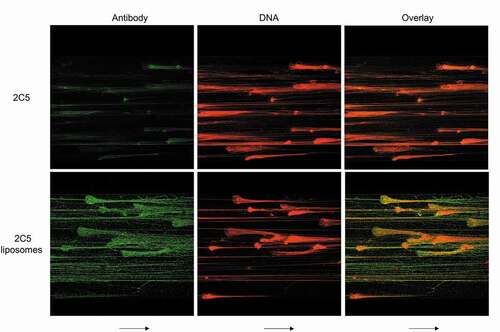
Figure 3. Microfluidic studies illustrating 2C5-NET interactions. Representative wide-field images of NETs formed in microfluidic channels, stained with SYTOX Orange (red), a DNA dye impermeable to live cells. The separate channels (included in the same visual field) were simultaneously infused at 2 dynes/cm2 with Alexa 488-labeled 2C5 and nonspecific IgG (green) (a) or Alexa 488-labeled liposomes modified with either 2C5 or nonspecific IgG on their surface (b). Arrows represent flow direction
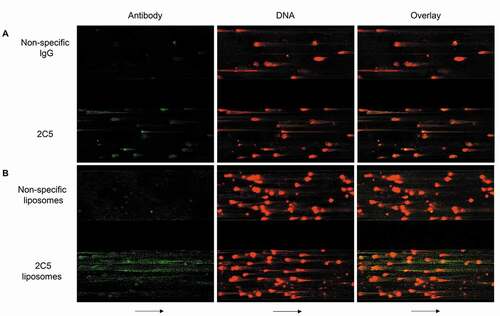
Figure 4. Morphological changes in NETs do not prevent 2C5 binding. The addition of platelet factor 4 (PF4 – a factor released by activated platelets in heparin-induced thrombocytopenia) induces chromatin compaction in NETs, as noted by reduction in NET area. PF4-NET complex formation also influences NET behavior by inducing DNase I resistance. However, 2C5 binding is not prevented, indicating that the conformational epitope required for 2C5 binding is preserved and available despite morphological changes. Arrows represent flow direction