
Figures & data
Figure 1. Three structural isoforms of IgG2 (A, A/B, and B) and their associated disulfide connections depicted with red lines. Modified and used with permission of American Chemical Society, from ref.;Citation15 permission conveyed through Copyright Clearance Center, Inc
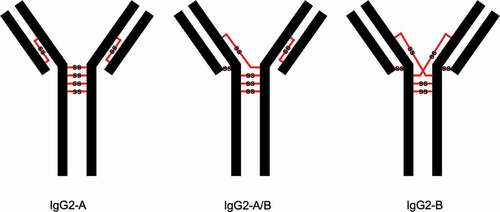
Figure 2. Depictions of doubly cysteinylated and classically linked IgG2-A forms. “Cys” denotes a terminal cysteine molecule that is disulfide bonded to a cysteine on the antibody. Modified and used with permission of American Chemical Society, from ref.;Citation15 permission conveyed through Copyright Clearance Center, Inc
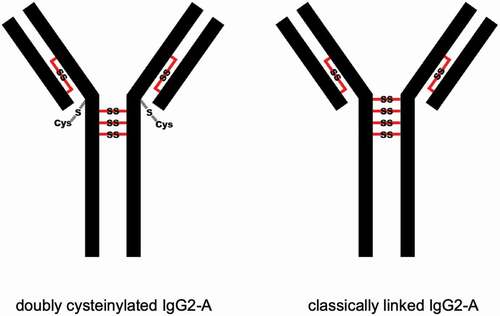
Figure 3. SIM experiments of mAb1-Y Lys-C peptide maps. (a) Extracted ion chromatograms of doubly cysteinylated and classically linked IgG-A hinge Lys-C dipeptides (10 ppm mass tolerance for extraction). (b) Corresponding MS1 spectra using Orbitrap detection (60 000 resolution). (c) Corresponding MS1 spectra that are zoomed-in on the mass features of interest

Figure 4. PRM experiments of mAb1-Y Lys-C peptide maps. Sequences of (a) doubly cysteinylated and (b) classically linked IgG2-A hinge Lys-C dipeptides annotated with b- and y-ion fragmentation sites. (c) Corresponding annotated PRM spectra using CID fragmentation and Orbitrap detection (30 000 resolution, 10 ppm mass tolerance for assignments). (d) Corresponding extracted ion chromatograms of precursor/b8 product ion transitions (10 ppm mass tolerance for extraction)
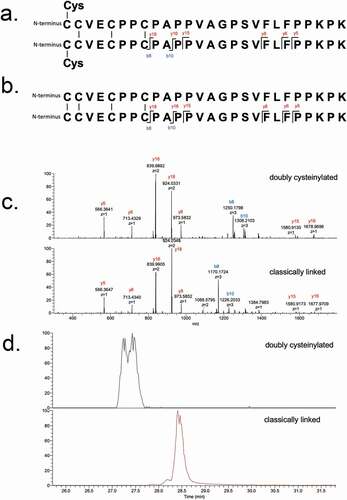
Figure 5. Deconvoluted mass spectra of a recombinant IgG cocktail sample (including IgG1, IgG2, and IgG4 antibodies) that has been subjected to Protein G pulldown or anti-IgG2 pulldown. The heterogeneity within each recombinant IgG subclass is predominantly attributable to Fc glycosylation
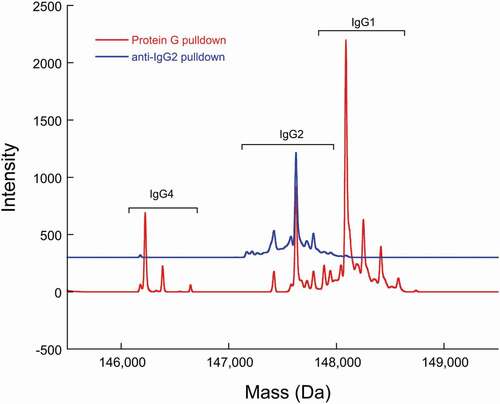
Figure 6. PRM analysis of doubly cysteinylated IgG2 standards (prepared by co-mixing mAb1-Y and mAb1-Z) showing a linear response
Table 1. PRM repeatability analysis with a 0.3% doubly cysteinylated IgG2-A control sample (prepared by co-mixing mAb1-Y and mAb1-Z). Nine replicates in total were analyzed
Figure 7. PRM experiments of endogenous IgG2 Lys-C peptide maps. (a) PRM spectra using CID fragmentation and Orbitrap detection (30 000 resolution, 10 ppm mass tolerance for assignments). (b) Corresponding extracted ion chromatograms of precursor/b8 product ion transitions (10 ppm mass tolerance for extraction). Depicted here is data of endogenous IgG2s affinity purified from a single human subject, as an example (in total 10 human subject samples were analyzed)
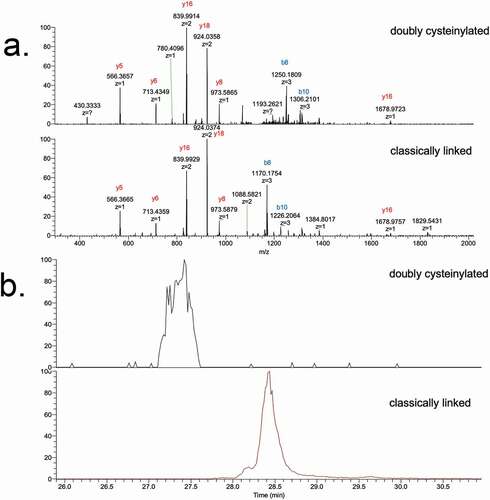
Table 2. Relative abundances of doubly cysteinylated IgG2-A form (%2Cys) in endogenous IgG2s purified from healthy human serum. XICdoubly cysteinylated and XICclassically linked are the extracted ion chromatogram peak areas of the precursor/product ion transitions for the doubly cysteinylated and classically linked IgG2-A Lys-C dipeptides, respectively. Demographic information corresponding to each human subject is included. There was no obvious correlation between hinge cysteinylation levels and age, gender or race, granted the sample size was small
Table 3. Comparison of endogenous exposure and dosed exposure (hypothetical) to doubly cysteinylated IgG2-A. Included are the mean values for parameters relevant to the exposure calculations
Table 4. Parent/b8-product ion transitions used for %2Cys quantitation of PRM experiments. The three b8-product ions listed represent the second, third, and fourth isotopes