Figures & data
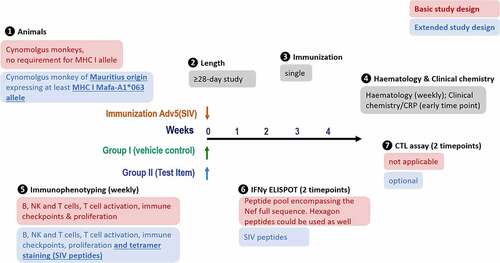
Figure 1. Study design. MHC I-genotyped Mauritian cynomolgus macaques (MCMs) were immunized with 3 replication incompetent adenovirus serotype 5 (Ad5) encoding Gag, Nef or Pol SIV (Simian immunodeficiency virus) proteins. One group received the anti-PD-L1 atezolizumab and the second group received an immune checkpoint-targeting bi-specific antibody mAbX in early development. Blood samples, from all animals, were taken on a weekly basis to characterize the T cell phenotype (Immunophenotyping) and function (IFNγ ELIspot and cytolytic T cell assay)
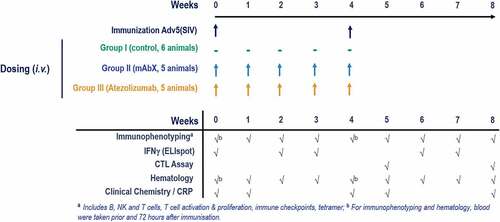
Figure 2. Changes in C-reactive proteins (a), globulin (b), and in the globulin/albumin ratio (c) in the peripheral blood following the immunization of Cynomolgus macaques (on weeks 0 and 4) for up to eight weeks. For each condition, * (p < .05) indicates statistical significance of the selected condition, compared to the untreated group
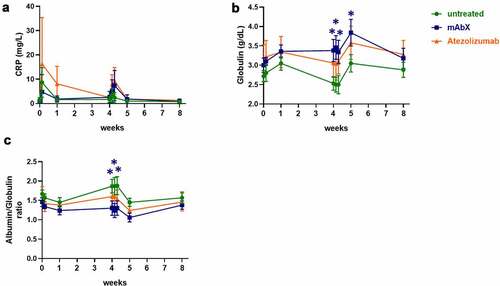
Figure 3. Changes in the numbers of NK (a), CD8+ (b), Tregs (c), and RM9-specific CD8+ T cells (d) in the peripheral blood following the immunization of Cynomolgus macaques (on weeks 0 and 4) for up to eight weeks. Depending on the amount of cells detected, data are expressed as 106 cells/mL or 103 cells/mL. For each condition, * (p < .05) indicates statistical significance of the selected condition, compared to the untreated group
Figure 4. Proliferation and activation profiles of CD4+ and CD8+ T cells for up to 8 weeks (A to D). Comparison of the proliferation and activation profiles at pre-dose and 2 weeks post first administration of Ad5(SIV) (E to H). For each group shown data are presented as the percentage of these subsets out of the total T cell subsets. For each condition, * (p < .05), ** (p < .01), *** (p < .001), & **** (p < .0001) indicates statistical significance of the selected condition, compared to the untreated group
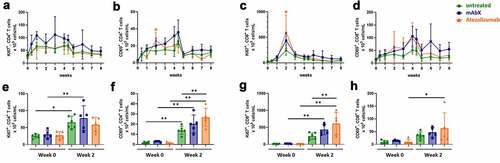
Figure 5. Frequency and phenotype of CD8 + T-cell subsets in NHPs. (a) Representative tSNE map of total CD8+ cells in NHP (untreated group), using CD45, CD3, CD4, CD8, CD20, CD159a, CD69, CD152, CD28, CD95, CD25, CD14, Ki67, and FoxP3 as markers. (b) Box plots showing the frequency of CD8 + T cells in each significantly enriched cluster. *p < .05
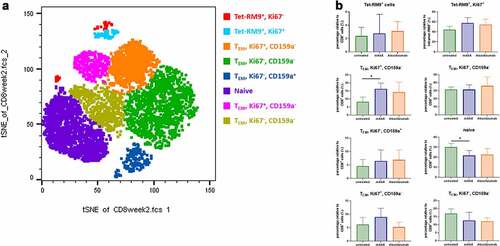
Figure 6. Modulation of immune checkpoints expressed on CD4+ T cells up to 8 weeks after administration of Ad5(SIV) (Weeks 0 and 4): (a), 4–1BB; (b), OX40; (c), B7-H4; (d), BTLA; (e), LAG3; and (f), TIM3. Results are represented as 103 cells/mL in blood. For each condition, * (p < .05) indicates statistical significance of the selected condition, compared to the untreated group
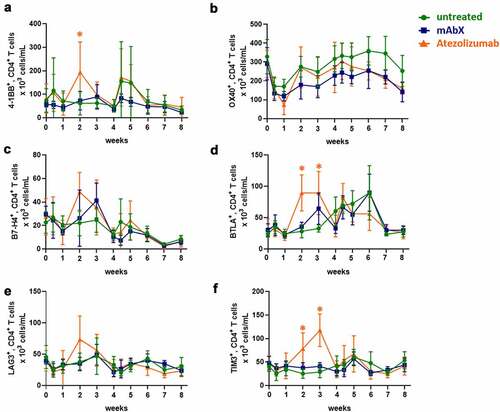
Figure 7. Modulation of immune checkpoint molecules expressed on CD8+ T cells up to 8 weeks after administration of Ad5(SIV) (Weeks 0 and 4): (a), 4–1BB; (b), B7-H4; (c), BTLA; (d), LAG3; (e), PD-1; (f), CTLA-4; (g), TIM3; and (h), VISTA. Results are represented as 103 cells/mL in blood. For each condition, * (p < .05) indicates statistical significance of the selected condition, compared to the untreated group
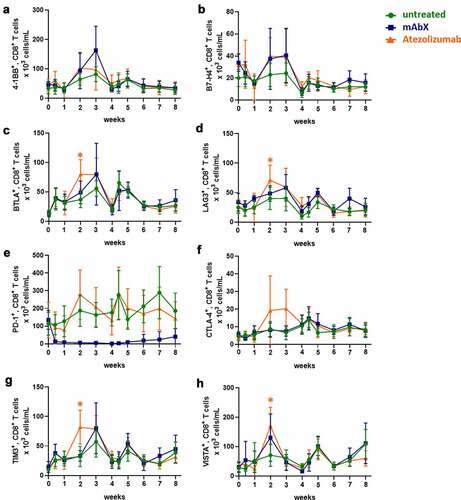
Figure 8. Detection of cellular IFNγ response by ELISPOT assay following ex-vivo stimulation of freshly isolated PBMCs (sixteen immunized MCMs) with a peptide pool covering the complete sequence of the Adenovirus hexon, at 0.6 µM (total peptide concentration, A and C) or with a pool of three Nef peptides (RM9, HW8 and LT9 at 10 µM each, B and D) or Conditions for which spots were too numerous to count were arbitrary set at 3000 SFCs per 106 PBMCs. *, p < .05 indicates statistical significance compared to the untreated group
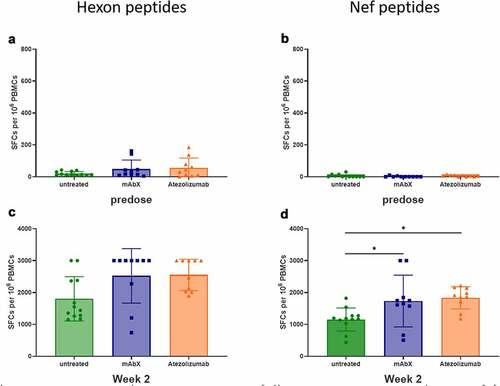
Figure 9. Determination of the cytolytic capacity of the Nef RM9-specific CD8+ T cells for each animal at week 5 and 8. (a) Each linear regression corresponds to one specific NHP. The steepness of the slope is indicative of the CTL activity. (b), Schematic representation of the coefficient slope derived from the linear regression depending on the dosing regimen
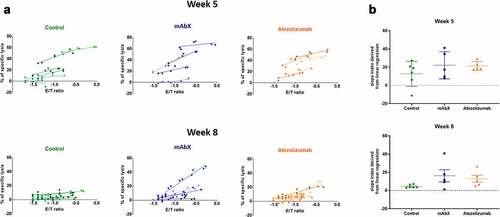
Figure 10. Proposed study design