
Figures & data
Figure 1. Analysis of dosing solutions yy SEC and ELISA. (a) Size exclusion Chromatograms (absorbance) of all dosing solutions. (b/c) Dosing solution with drugPGLALA + pADA<CDR> (b) and drugPGLALA + mADA<Fc> (c): Absorbance (solid line) and reconstructed ELISA profile (dashed line). No monomeric drug detectable in the reconstructed ELISA IC profiles. Elution of monomeric IgG at ~ 22.5 min
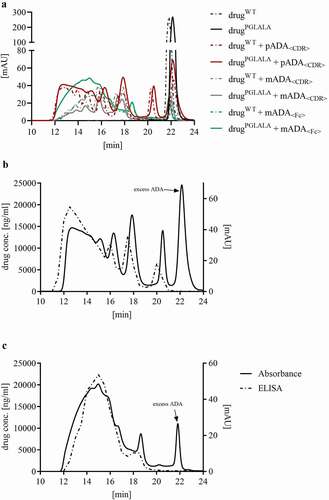
Table 1. Composition of the IC dosing solutions. The percentages of defined IC sizes in the dosing solutions were determined by analyzing the area under the curve of the UV trace of the SEC chromatograms. The “% monomeric ADA” listed in the table is the value of the area under the curve of the ADA monomer UV peak
Figure 2. Comparison of the total drug concentration in serum and plasma. Blood from groups dosed with drugPGLALA or drugPGLALA + pADA<CDR> was divided for serum and plasma preparation and the total drug concentration was determined yy acid dissociation ELISA to study potential influences of serum/plasma preparation on drug concentration when complexed with ADAs
Figure 3. Total drug concentration in serum samples of all groups (PK data was fitted to a 2 compartment model for intra venous bolus injection by statistical method, with relative standard deviation (coefficient of variation), n = 3)
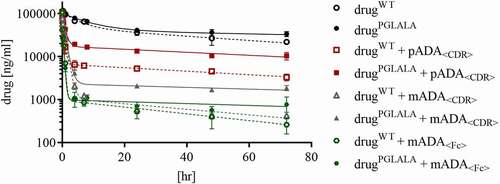
Figure 4. Reconstructed drug + pADA<CDR> IC profiles from serum samples (mean values of all three animals). (a) ICs were separated by SEC, fractionated, and he drug concentration in every collected fraction was determined by total drug ELISA to reconstruct the IC profiles. Potential elution of monomeric drug is marked with a dashed line. Elution time [min] refers to the elution of drug/ICs from the SEC column. (b) Defined time points were selected for comparison of drugWT + pADA<CDR> and drugPGLALA + pADA<CDR> indicating clearance differences of the respective dimeric and tetrameric ICs
![Figure 4. Reconstructed drug + pADA<CDR> IC profiles from serum samples (mean values of all three animals). (a) ICs were separated by SEC, fractionated, and he drug concentration in every collected fraction was determined by total drug ELISA to reconstruct the IC profiles. Potential elution of monomeric drug is marked with a dashed line. Elution time [min] refers to the elution of drug/ICs from the SEC column. (b) Defined time points were selected for comparison of drugWT + pADA<CDR> and drugPGLALA + pADA<CDR> indicating clearance differences of the respective dimeric and tetrameric ICs](/cms/asset/994a178a-f12b-4717-bbc4-2a7239c21772/kmab_a_1995929_f0004_oc.jpg)
Figure 5. Reconstructed drug + mADA<CDR> IC profiles from serum samples (mean values of all three animals). (a) ICs were separated by SEC, fractionated, and the drug concentration in every collected fraction was determined by total drug ELISA to reconstruct the IC profiles. Potential elution of monomeric drug is marked with a dashed line. Elution time [min] refers to the elution of drug/ICs from the SEC column. (b) Defined time points were selected for comparison of drugWT + mADA<CDR> and drugPGLALA + mADA<CDR> indicating clearance differences of the respective dimeric and tetrameric ICs
![Figure 5. Reconstructed drug + mADA<CDR> IC profiles from serum samples (mean values of all three animals). (a) ICs were separated by SEC, fractionated, and the drug concentration in every collected fraction was determined by total drug ELISA to reconstruct the IC profiles. Potential elution of monomeric drug is marked with a dashed line. Elution time [min] refers to the elution of drug/ICs from the SEC column. (b) Defined time points were selected for comparison of drugWT + mADA<CDR> and drugPGLALA + mADA<CDR> indicating clearance differences of the respective dimeric and tetrameric ICs](/cms/asset/12fe099f-988e-4e29-9297-08afffb391f7/kmab_a_1995929_f0005_oc.jpg)
Figure 6. Reconstructed drug + mADA<Fc> IC profiles in serum samples (mean values of all three animals). ICs were separated by SEC, fractionated, and the drug concentration in every collected fraction was determined by total drug ELISA to reconstruct the IC profiles. Potential elution of monomeric drug is marked with a dashed line. Elution time [min] refers to the elution of drug/ICs from the SEC column. IC profiles for later time points (8 hr – 72 hr) are not illustrated because of very low concentration
![Figure 6. Reconstructed drug + mADA<Fc> IC profiles in serum samples (mean values of all three animals). ICs were separated by SEC, fractionated, and the drug concentration in every collected fraction was determined by total drug ELISA to reconstruct the IC profiles. Potential elution of monomeric drug is marked with a dashed line. Elution time [min] refers to the elution of drug/ICs from the SEC column. IC profiles for later time points (8 hr – 72 hr) are not illustrated because of very low concentration](/cms/asset/344a5aa8-61fe-440b-8326-9070dd90568f/kmab_a_1995929_f0006_b.gif)
Table 2. Clearance values of monomeric drug and drug complexed in defined IC species