Figures & data
Table 1. All phage-displayed antibody libraries were designed by assembling synthesized oligo pools encoding CDRs as human scFv and Fab or humanized single domain nanobody (VHH) fragments fused to the attachment protein gene 3 protein (G3P). TB181 COVID-19 scFv incorporates germline gene segments encoding heavy chain VH3–23 and light chain VL2–23. The TB182 Fab library uses VH3–23 and VK1–39. Both VHH libraries use a humanized DP-47 framework.Citation23 The number of phage binders identified from the Round 4 panning output of each library is listed along with the number of unique antibodies discovered. Following phage panning and screening, a total of 235 antibody fragments were converted to either human IgG1 or a VHH-Fc fusion containing the Fc region of human IgG1 for further characterization of the purified antibody
Figure 1. Identification of high-affinity mAbs against SARS-CoV-2 S1 subunit and pre-fusion stabilized S trimers. (a) Schematic of antibody library designs used in phage panning. Numbers on white text on green indicate the number of CDRs represented within each oligo pool per library. Purple blocks represent human or humanized germline framework regions; gray blocks represent llama framework regions. (b) Binding affinity of lead antibodies, as determined by SPR, demonstrating nanomolar binding to the SARS-CoV-2 spike S1 subunit. Leads from TB181 COVID-19 scFv and TB182 Fab libraries were reformatted and expressed as IgG1, while leads from TB201 VHH and TB202 VHH libraries were converted to VHH-Fc. Apparent binding affinity to spike trimers stabilized in the pre-fusion conformation are in the picomolar range.Citation26 SPR experiments were performed on a Carterra LSA SPR biosensor, binding affinities were calculated by fitting to 1:1 model in Carterra Kinetics Tool software. See Materials and Methods for complete assay description. (c) Competition ELISA showing decreasing levels of S1 RBD binding to immobilized ACE2 on Nunc Maxisorp plates with increasing concentrations of antibody. The experiment was performed in singlicate. (d) inhibition flow cytometry experiment showing lowering levels of S1 RBD binding to Vero E6 cells expressing ACE2 as measured by decreasing mean fluorescence intensity (MFI) as antibody concentrations increase. The experiment was performed in triplicate with standard deviation shown as error bars
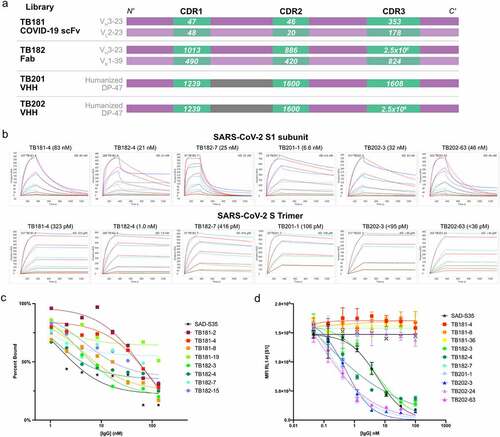
Figure 2. Sequence diversity and characterization of 235 SARS-CoV-2 S1-binding antibodies. Phylogenetic tree of SARS-CoV-2 S1-binding IgG (blue lines) and VHH-Fc (black lines) candidates identified by phage display. Green bars represent the binding affinity of each candidate as measured by SPR. Relative binding affinity is displayed linearly, a longer bar indicates improved binding affinity. The longest bar represents an observed binding affinity of 2 nM, the shortest visible bar represents 6.6 μM. No bar indicates no binding observed. Purple gradient represents the percent inhibition of each antibody in the Vero E6 competition assay at 100 nM mAb, weak inhibitors are represented in white, strong inhibitors are represented in purple. Phylogenetic tree data generated by aligning variable heavy sequences with MUltiple Sequence Comparison by Log-Expectation (MUSCLE).Citation27 circular dendrogram figure constructed using interactive tree of life (iTOL).Citation28
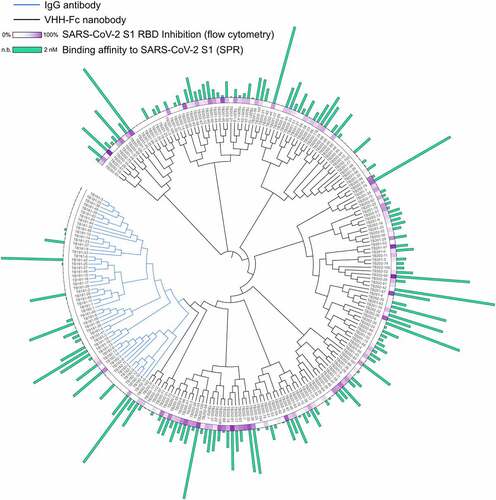
Figure 3. Competition binning of SARS-CoV-2 S1-binding antibodies. Cross-competition of antibody candidates with SARS-CoV-2 S1 protein was assayed by high throughput (HT)-SPR using the carterra LSA. Red, yellow, and green cells in the heat map represent competitive, weakly competitive, and noncompetitive blocked analyte/ligand pairs, respectively. White cells represent unaddressed pairs in the assay. Numbers in cell indicate the relative binding response to SARS-CoV-2 S1 only
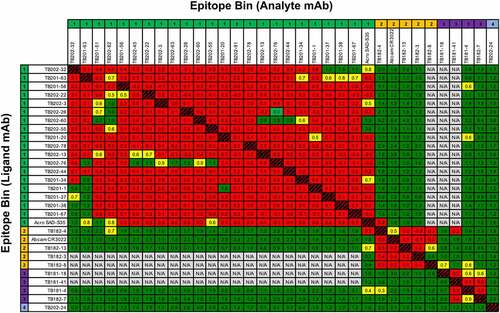
Figure 4. Neutralizing activity of top antibody candidates. (a) 40 blinded samples were tested in a PRNT (at USAMRIID) using the authentic SARS-CoV-2 Washington isolate. All samples were run in at least two independent assays. Shaded bars indicate only one value used to determine titer, where the first assay used in a dilution series does not reach an endpoint titer. The NT80 value was calculated by dividing the sample concentration by PRNT80 titer. NT80 values were sorted lowest to highest, or most potent to least potent. (b) in a separate experiment conducted by IBT, IgG and VHH antibodies again demonstrated potent neutralization in an authentic SARS-CoV-2 PRNT. NT50 and NT90 represent the antibody concentration required to reduce the number of plaques by 50% or 90%, respectively, compared to free virus
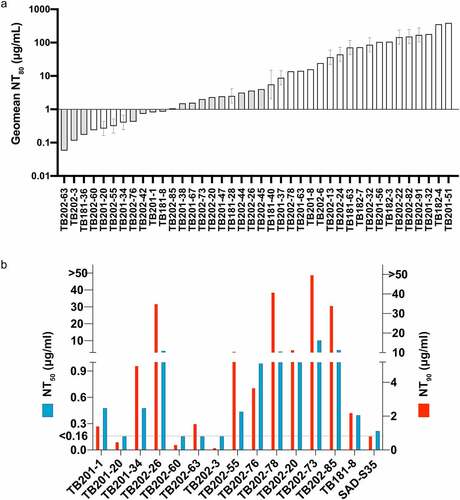
Figure 5. Hamster challenge models. (a-c) In a pre-challenge hamster challenge model,Citation31 administration of monoclonal antibodies 12 hours prior to SARS-CoV-2 (WA1) infection prevented weight loss. TB202–3 and TB202–63, both in VHH-Fc format, conferred protection from weight loss at 1 mg/kg relative to isotype control c7D11 (*p < .05, **p < .01). The IgG TB181–36 conferred protection at 5 mg/kg and 10 mg/kg (see supplemental Figure 5). Data is plotted as mean ± standard error of mean. (d) post-challenge efficacy study of TB202–3 (1.5 mg/kg) with high-dose intranasal SARS-CoV-2 infection in golden syrian hamsters at various time points between day 0 and day 3 (i.e., 6 and 48 hours, 12 and 48 hours, 24 and 72 hours). (e) TB202–3 conferred significant protection in percent weight change at days 5–8 with the 6- and 48-hour dosing regimen (*p < .05, **p < .01, ***p < .001) (f) health scores from the experiment shown in Figure 5d of hamsters at days 1–14 post-exposure. (g) post-challenge hamsters were sacrificed on day 4 to measure viral load in lung and nares following treatment with TB202–3 at various timepoints. Significant reduction of viral titers was observed in the lungs (p < .0001, 2-way ANOVA) relative to vehicle only control. Some reduction in titers was observed in the nostrils, however the decrease was not statistically significant. No detectable virus was observed in the spleen or brain. All studies described in this figure were managed by integrated biotherapeutics and performed at a BSL-3 subcontractor facility (BIOQUAL, rockville Md)
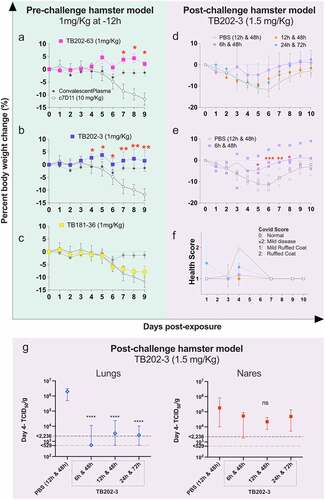
Figure 6. Effect of antibody cocktail treatment post-exposure in hamster challenge model (USAMRIID). (a) Animals were immunosuppressed and then exposed to SARS-CoV-2 virus, WA1 strain, on Day 0. Antibody cocktail containing TB181–36 and TB202–63 was administered on the indicated day post-exposure (D1, D2, etc marked by blue arrow, corresponding to Groups B-G). A control group received the cocktail on Day −1 (D-1, Group A). A group was immunosuppressed but not exposed to virus (cyclophosphamide [CYP] control, group i). An IgG monoclonal (c7D11Citation33) was administered to Group H as a negative control. Data is presented as mean ± standard error of mean, *p < .05, **p < .01. Experimental groups and all common events are listed in Supplemental Table 3. (b) Percent weight change from all groups, same data from Fig 6a plotted in one graph. (c) Infectious virus in lungs of hamsters on day 14. Lung homogenates were assayed for infectious virus by plaque assay, plaque forming units (PFU) per gram of tissue were calculated and plotted. The limit of the assay is shown as a dotted line. Bars are the geometric means for each group. Groups are denoted in parentheses. White symbols indicated no infectious virus was detected
![Figure 6. Effect of antibody cocktail treatment post-exposure in hamster challenge model (USAMRIID). (a) Animals were immunosuppressed and then exposed to SARS-CoV-2 virus, WA1 strain, on Day 0. Antibody cocktail containing TB181–36 and TB202–63 was administered on the indicated day post-exposure (D1, D2, etc marked by blue arrow, corresponding to Groups B-G). A control group received the cocktail on Day −1 (D-1, Group A). A group was immunosuppressed but not exposed to virus (cyclophosphamide [CYP] control, group i). An IgG monoclonal (c7D11Citation33) was administered to Group H as a negative control. Data is presented as mean ± standard error of mean, *p < .05, **p < .01. Experimental groups and all common events are listed in Supplemental Table 3. (b) Percent weight change from all groups, same data from Fig 6a plotted in one graph. (c) Infectious virus in lungs of hamsters on day 14. Lung homogenates were assayed for infectious virus by plaque assay, plaque forming units (PFU) per gram of tissue were calculated and plotted. The limit of the assay is shown as a dotted line. Bars are the geometric means for each group. Groups are denoted in parentheses. White symbols indicated no infectious virus was detected](/cms/asset/ce98ac74-5ce2-4a0e-a23d-5b295b3a28c3/kmab_a_2002236_f0006_oc.jpg)
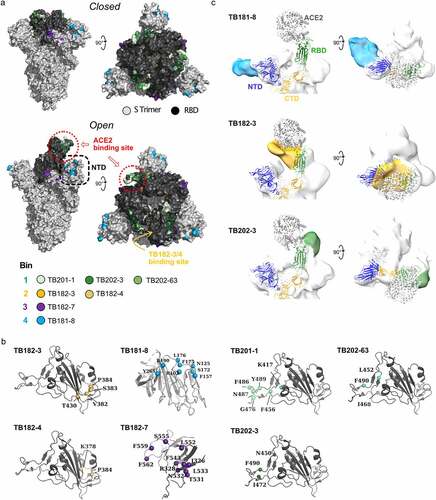
Figure 7. Epitope mapping of SARS-CoV-2 S1-binding antibodies. (a) Solvent-accessible surface representation of spike protein trimer in closed (PDB: 6VXX) and open (PDB: 6VSB) conformations. VHH-Fc nanobodies (TB201, TB202) binding sites overlap with that of ACE2 in both conformations, while TB181 and TB182 IgGs access a more occluded region. (b) Cartoon representation of SARS-CoV-2 S protein RBD with critical residues highlighted as spheres for each monoclonal antibody. (c) Negative-staining electron microscopy analysis shows the distinct binding regions of antibodies identified from the distinct antibody libraries used in this study (colored surface). The SARS-CoV-2 spike protein NTD, C-terminal domain (CTD), RBD and bound ACE2 are shown as cartoon representations