Figures & data
Figure 1. Comparison of thermodynamic and kinetic parameters of IgG1-FcγRIIIa with that of IgG1-Fcs-FcγRIIIa obtained by (a) ITC and (b) BLI.
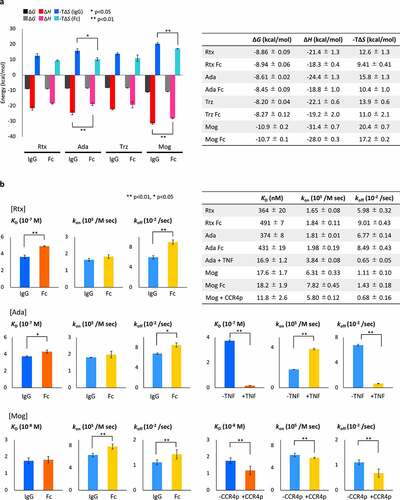
Figure 2. HDX-MS analysis of IgG. Left panels show cumulative differences in HDX comparing (a) Mog with Rtx, (b) Rtx with Rtx binding to FcγRIIIa, (c) Mog with Mog binding to FcγRIIIa, (d) Mog with Mog binding to CCR4p and (e) Mog with Mog binding to CCR4p and FcγRIIIa. The blue-shaded regions represent the CDR based on abYsis (http://www.abysis.org/), the red-shaded regions represent the reported binding sites by Sondermann et al.,Citation12 and dashed lines represent the criteria of significant difference. The right panel shows the mapping of HDX-MS results onto homology models of Mog (a, c, d and e) and Rtx (b). Structural segments that showed decreases in deuterium uptake are shown in blue, unidentified regions in light gray, the light chain in cyan and the heavy chain in green. The homology models were built by Discovery Studio (Dassault Systèmes) using the crystal structure of the human anti-human immunodeficiency virus-1 gp120 IgG1 (PDB ID: 1HZHCitation29) as the template.
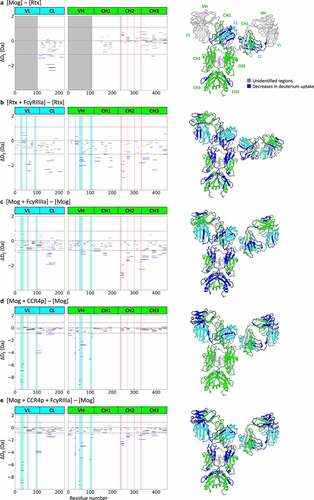
Figure 3. HDX-MS analysis of FcγRIIIa. Left panels show cumulative differences in HDX comparing (a) FcγRIIIa with FcγRIIIa binding to Rtx, (b) FcγRIIIa with FcγRIIIa binding to Mog and (c) FcγRIIIa with FcγRIIIa binding to the CCR4p-Mog complex. The red-shaded regions represent the reported binding sites by Sondermann et al.,Citation12 and dashed lines represent the criteria of significant difference. The right panel shows the mapping of HDX-MS results onto a crystal structure of FcγRIIIa extracted from the Fc-FcγRIIIa complex (PDB ID: 3AY4Citation14). Structural segments that showed decreases in deuterium uptake are shown in blue, increases in red, unidentified regions in light gray, D1 in Orange and D2 in pink.
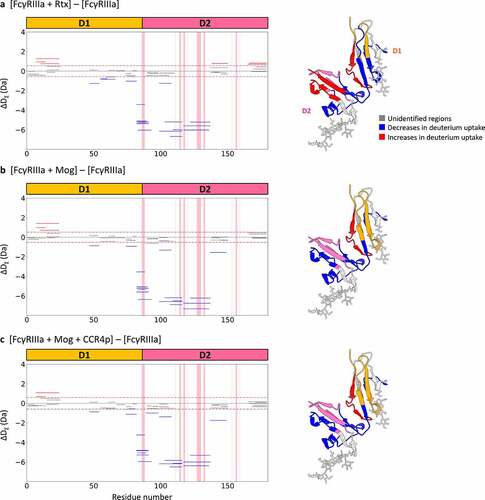
Figure 4. Superposition of the four best solutions from the lowest energy clusters of Rtx-Fab-Fc-FcγRIIIa (left) and Mog-Fab-Fc-FcγRIIIa (right). The light chains of Fab are shown in cyan, the heavy chains of Fab in green, the Fc in light gray, D1 of FcγRIIIa in Orange and D2 of FcγRIIIa in pink.
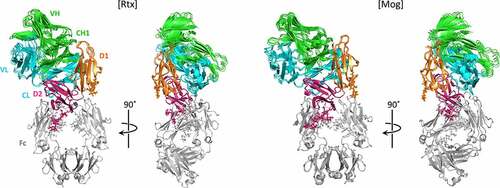
Figure 5. Mapping the HDX-MS results onto the obtained model for Fab-FcγRIIIa extracted from the best solution of the Rtx-Fab-Fc-FcγRIIIa complex. Structural segments with decreases in deuterium uptake are shown in blue, the light chains of Fab in cyan, the heavy chains of Fab in green, D1 of FcγRIIIa in Orange and D2 of FcγRIIIa in pink. The expanded views show contact interfaces 1 and 2 between Fab and FcγRIIIa.
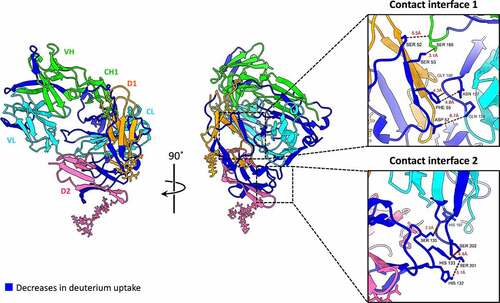
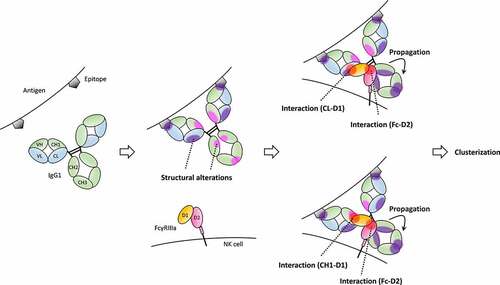
Figure 6. Proposed binding model based on our HDX-MS and XL-MS analyses with previous reports.Citation21–24,Citation37 The light chains of IgG are shown in blue, the heavy chains of IgG in green, D1 of FcγRIIIa in Orange, D2 of FcγRIIIa in pink and antigens in dark gray. Antigen-binding to IgG causes structural alterations in CL (purple-filled circles). In addition, structural alterations to CH1, CH2 and CH3 (magenta-filled circles) in addition to CL were also caused by antigen-binding depending on antigen types. Then, IgG interacts with FcγRIII through both Fab and Fc. Fab has two different patterns of interaction with FcγRIII, CL-FcγRIII and CH1-FcγRIII interactions. IgG-FcγRIII interaction is associated with structural changes to Fc that propagate from CH2 to CH3 to mediate clusterization of the IgG-FcγRIII complex on the cell surface.