Figures & data
Table 1. Data collection and refinement statistics
Table 2. Hydrogen bond interactions between PD1 and 609A Fab
Figure 1. The crystal structure of the PD1/609A Fab complex showed that the heavy chain of 609A plays a dominant role in establishing the interaction of the antibody with PD1. (a,b) Close-up views of the hydrogen bond interaction between PD1 and the heavy chain of 609A Fab (left) or the light chain of 609A Fab (right). The residues that formed hydrogen bonds are shown as sticks. PD1, the Fab heavy chain and light chain are colored blue, green and pink, respectively. The key hydrogen bonds are highlighted as yellow dash lines. (c) A ribbon representation of the PD1 structure. The residues that contact with the 609A Fab are shown in sticks. Salt bridge interactions, hydrogen bond interactions and water-bridged hydrogen bond interactions are colored Orange, pink and green, respectively. The residues that are involved in both hydrogen bond interactions and water-bridged hydrogen bond interactions are colored marine. The N-loop (N-ter) is colored red. (d) A close-up view of the salt bridge interaction between PD1 and the heavy chain of 609A Fab. The residues are shown as sticks. PD1 and the Fab heavy chain are colored blue and green. The ionic bonding is highlighted as yellow dash lines.
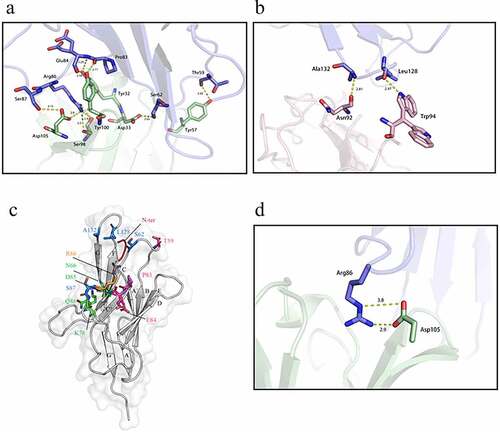
Figure 2. The alanine scanning of the CDRs in 609A light chain demonstrated the dominance of the heavy chain in binding to PD1. (a) Residues in the CDRs (CDR1: red, CDR2: blue, CDR3: green) of the 609A light chain were substituted to Alanine by site-directed mutagenesis individually. The binding abilities of the resulting 609A variants to PD1 were measured in triplicate by ELISA (n = 2) and compared with that of the parental mAb, 609A. PD1 protein was coated on the plate. The 609A variants, 609A and the isotype control mAb were serially diluted and added to the plate. (b) The abilities of these 609A variants to activate T cells were assayed in triplicate using a cell based PD1/PDL1 blockade system (Promega) and compared to that of 609A (n = 2). N = the number of independent experiments. The luciferase expression under the control of the NFAT response elements in response to PD1/PDL1 blockade were measured and plotted as the Luminescence readout.
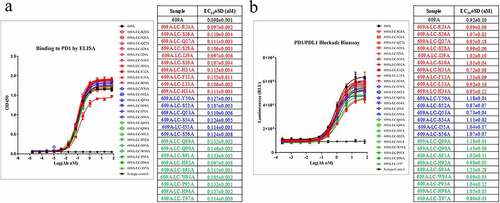
Table 3. Characterization of the pairings of the 609A heavy chain with a variety of light chains
Figure 3. All 12 light chains were able to dimerize with the heavy chain of 609A. (a) 11 of the 12 pairings were capable of binding to PD1 with EC50ʹs ranging from 0.15 nM to 1.05 nM. The pairing of 609A heavy chain with the light chain of mAb10, 609HC-10LC, failed to bind to PD1. PD1 protein was coated on the plate. The 609A hybrid pairings, 609A, Opdivo and an isotype control were serially diluted and added to the plate in triplicate (n = 2). (b) 11 of the 12 pairings were capable of binding to TF1 cells overexpressing PD1. The pairing of 609A heavy chain with the light chain of mAb10, 609HC-10LC, failed to bind to PD1-expressing TF1 cells. The 609A hybrid pairings, 609A and an isotype control were serially diluted and added to the cells, followed by measurement by FACS. (c) All pairings were able to equally block the interaction of PD1 and PDL1 as effectively as 609A by ELISA in triplicate (n = 2).
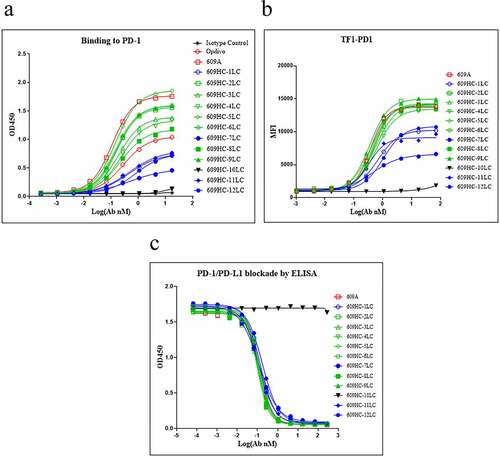
Figure 4. Construction of novel common-light-chain linear-Fab-based (CLF2) bispecific antibodies. (A) schematics show the structure of the CLF2 platform, (b) the anti-PD1xPDL1 BsAb and (c) the anti-PD1xCTLA4 BsAb. Horizontal lines represent disulfide bonds.
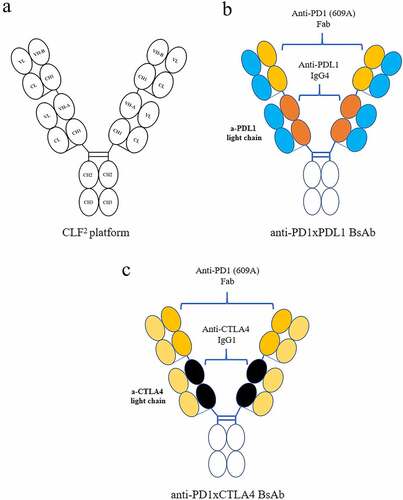
Figure 5. The BsAbs generated from the CLF2 platform exhibited IgG-like physicochemical properties without the need for engineering. (a) SEC Chromatograms of 609A, anti-PD1xPDL1 BsAb and anti-PD1xCTLA4 BsAb after single-step protein A purification (panel i); Reducing CE (R-CE) graphs of 609A, anti-PD1xPDL1 BsAb and anti-PD1xCTLA4 (panel ii); IEC Chromatograms of 609A, anti-PD1xPDL1 BsAb and anti-PD1xCTLA4, respectively (panel iii). (b) DSC graphs of 609A (left) and the anti-PD1xPDL1 BsAb, respectively (right). (c) the purity (%) of 609A and the anti-PD1xPDL1 BsAb was analyzed using SEC (top) and IEC (bottom) after the accelerated stability assay and plotted as a function of time (month). 609A (red line and star), the anti-PD1xPDL1 BsAb (blue line and circle). (d) Pharmacokinetics of the two BsAbs was analyzed in rats.
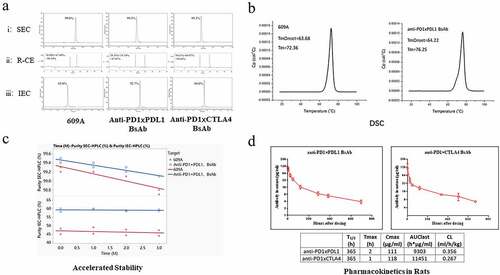
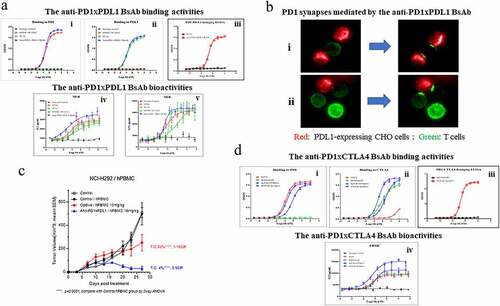
Figure 6. The BsAbs exhibited superior bioactivities to the mAb counterparts in vitro and in vivo. (a) Binding abilities of the anti-PD1xPDL1 BsAb, an isotype antibody and (i) the parental pairing, 609HC-9C10LC or (ii) the parental anti-PDL1 mAb, 9C10 to PD1 or PDL1 were measured in triplicate by ELISA (n = 3). PD1 or PDL1 proteins were coated on the plates, respectively. The indicated proteins were serially diluted and added to the corresponding plates. iii) A bridging ELISA was done in a way that PDL1 was coated on the plate, followed by detection of biotinylated PD1 captured by the BsAb in the solution. iv–v) The abilities of the anti-PD1xPDL1 BsAb, an isotype antibody, 609HC-9C10LC, 9C10 and 609A to stimulate the secretion of IL2 (left) and IFNγ (right) from T cells in the presence of Dendritic cells (DCs) were measured in triplicate by mixed lymphocyte reaction (MLR) (n = 3). (b) PD1-overexpressing Jurkat T cells were stimulated to enhance PD1 expression. The activated T cells were labeled with Alexa Fluor 488 (488)-conjugated anti-PD1xPDL1 BsAb. PDL1-expressing CHO cells were stained with cell proliferation Dye eFluorTM 670 (Thermo fisher). The pre-stained T and CHO cells were then co-cultured and filmed on an Operetta CLS high-content analysis system (PerkinElmer). (i–ii) are representative Time-lapse movie frames showing the progress of the formation of PD1 immunological synapses. Green: T cells, Red: PDL1-expressing CHO cells. (c) A control (close black circle), Opdivo (red circle) and the anti-PD1xPDL1 BsAb (blue triangle) were injected into M-NSG mice bearing NCI-H292 tumors in the presence of human PBMCs at the indicated doses. Tumor volumes (mm3) were measured at the indicated time points. T/C means the ratio of tumor volumes between the treated group and the control group. CR means complete response. **** P < .0001 calculated by two-way ANOVA for the comparison of all indicated groups with the control group. (d) Binding abilities of the anti-PD1xCTLA4 BsAbs with two opposite orientations (609Fab-IpiIgG1 and IpiFab-609IgG1), 609A and ipilimumab to (i) PD1 or (ii) CTLA4 were measured in triplicate by ELISA (n = 3). PD1 or CTLA4 proteins were coated on the plates, followed by adding serial dilutions of indicated antibodies to the plates. iii) The bridging ELISA was setup as above, except that CTLA4 was coated on the plate. iv) The amount of IL2 secreted from SEB-activated human PBMCs in the presence of the anti-PD1xCTLA4 BsAbs (609Fab-IpiIgG1 and IpiFab-609IgG1), an isotype antibody, ipilimumab or 609A were measured in triplicate by ELISA, respectively (n = 3).