Figures & data
Figure 1. In vitro neutralization activity of UT28K mAb. (a, b) Effects on the neutralization of pseudotyped SARS-CoV-2 infections (a) and authentic virus infections (b) through UT28K mAb. The Y-axis indicates the % of neutralization of pseudotyped SARS-CoV-2 infection in VeroE6/TMPRSS2 cells (A) and % of yield reduction (B) in the presence of the indicated concentration of UT28K mAb. Data are shown as the means ± s.d. of triplicate wells (B). All data are shown a single experiment representative of at least two independent experiments.
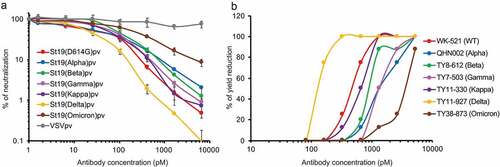
Figure 2. Pseudotyped SARS-CoV-2 infection in hamster model at prophylactic treatment. (a) Representative IVIS images of the lungs of individual hamsters are shown. (b) The luminescence measurements from the lungs infected by luciferase-expressing pseudotyped SARS-CoV-2. The Y-axis indicates the relative luminescence level to control antibody. (c) RT–qPCR was used to measure the VSV N expression in lung tissues. Data are shown as the means ± s.d. p-values were calculated using Student’s t-test (*, p < .05 and **, p < .01).
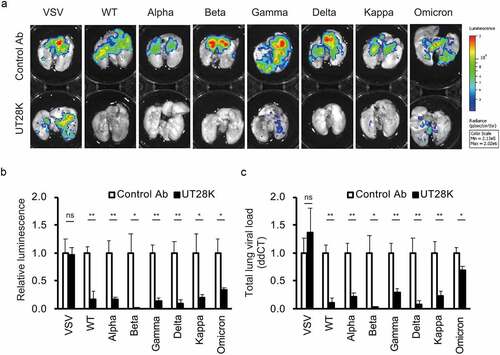
Figure 3. Structures of antibody UT28K bound to the SARS-CoV-2 S protein and their interactions. (a) Cryo-EM structure of Fab UT28K bound to the SARS-CoV-2 S protein trimer. The heavy and light chains of Fab UT28K are shown in pink and marine blue, respectively. The S1 and S2 subunits are shown in gray and black, respectively. The N-linked glycans are shown in cyan. (b) The crystal structure of Fab UT28K bound to the SARS-CoV-2 S protein RBD. The colors of Fab UT28K are the same as shown in A. The SARS-CoV-2 S RBD is shown in green. (c) A comparison of the binding modes of antibodies UT28K and 253XL55 (VH; yellow and VL; Orange) bound to the SARS-CoV-2 S protein RBD. (d-g) Interactions of key residues between Fab UT28K and the SARS-CoV-2 S RBD.
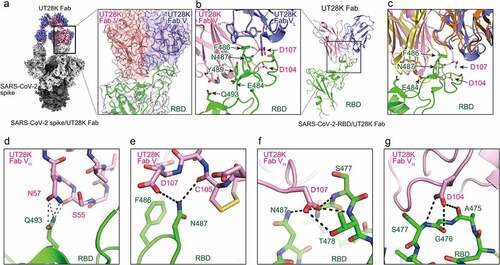
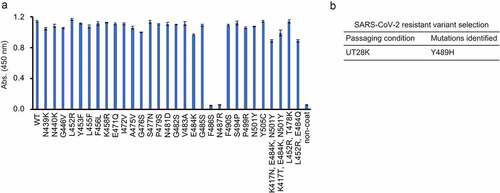
Figure 4. Epitope mapping of UT28K mAb. (a) The binding capacity of UT28K to individual mutant RBD proteins was examined by an ELISA. Data are shown as the means ± s.d. of triplicate wells. Data are representative of at least two independent experiments that were performed with similar results. (b) Table showing the results of the passage SARS-CoV-2 escape selection experiments.