
Figures & data
Figure 1. In silico descriptor classes. Over 900 in silico descriptors were calculated for the 5268 antibody sequences used in this study. The descriptors are classified into 4 categories. (a) Patch- descriptors computed from clusters of solvent-exposed atoms. (b) Sequence descriptors that assign various propensities to each amino acid, which are then summed across the sequence of an antibody. These include, but are not limited to, secondary-structure propensity and various hydrophobicity scales. (c) Scalar descriptors are singular values which rely on interdependent interactions within the molecule, such as isoelectric point (pI) (d). Region descriptors use scores from patch and sequence descriptors but are calculated on a subset of the antibody sequence or structure (e.g., hydrophobic or charge patches in HCDR3).
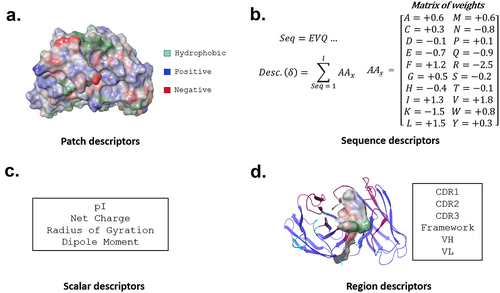
Figure 2. Analysis of individual descriptors. All repertoire and clinical antibodies are scored with each descriptor. A receiver operating characteristic (ROC) curve is then calculated by setting a cutoff between repertoire and clinical sequences at the lowest value calculated, forcing all sequences to fall into one class. This cutoff is continuously adjusted until all sequences are predicted to be in the alternative class. At every cutoff, a true positive rate (TPR) and false positive rate (FPR) is determined. The area under the curve (AUC) measures the performance of each descriptor at separating clinical from repertoire.
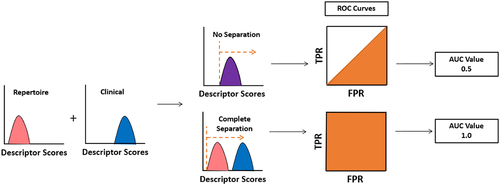
Figure 3. Area under the curve (AUC) of each descriptor. The AUC value for each descriptor is calculated. Most descriptors receive an AUC close to 0.5.
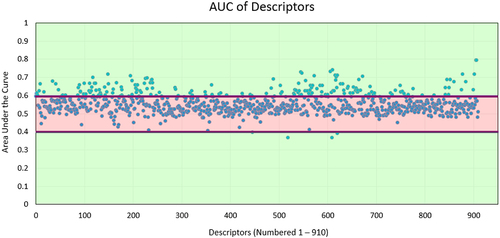
Figure 4. TA-DA – integration of five selected descriptors. Five descriptors were selected to be combined into a single score, termed TA-DA. Two of the descriptors (panels A and B) use patches (shown in red) calculated by AggScore to separate clinical antibodies from repertoire antibodies.Citation31 The third descriptor (panel C) considers the positive patches (shown in blue) in the CDRs of the light chain. The fourth descriptor (panel D), All_Atomic_Contact_Energy, rewards burial of hydrophobic atoms (shown in green) and the solvent exposure of charged atoms (shown in blue and red) and penalizes the reverse. Lastly, a sequence-based descriptor, TOP-IDP (panel E), is summed over the entire antibody sequence, with weights given to each amino acid, with lower scores being clinically enriched.Citation32
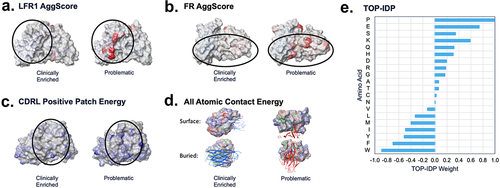
Figure 5. TA-DA performance on hold-out test set. Twenty clinical-stage antibodies and 20 repertoire antibodies, withheld from the training set, were scored with the Therapeutic Antibody Developability Analysis (TA-DA) model. Scores for repertoire sequences are shown on the left and scores for clinical sequences are shown on the right. AUC, confidence intervals, and p-values are reported.
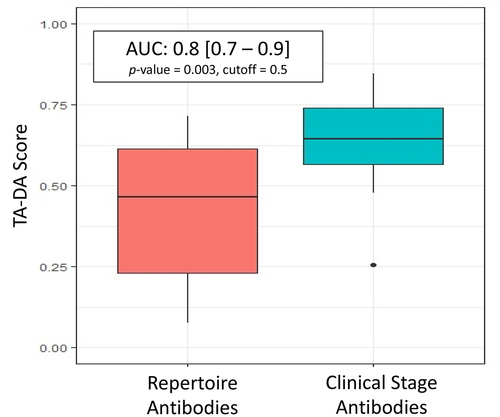
Figure 6. TA-DA performance on bispecifics. Thirteen bispecific clinical stage therapeutics (CSTs) were scored with TA-DA. Variable domains identical or closely related to the training set are removed, resulting in 22 test sequences. Scores above 0.55 are predicted to be clinical-like. 18 of the 22 variable regions receive a score above 0.55.
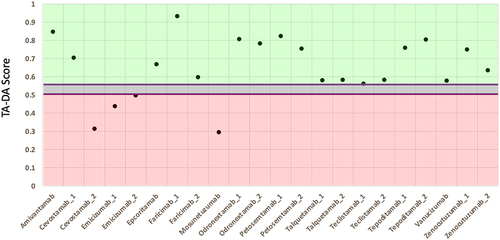
Figure 7. Pairwise sequence identity distributions between CST and repertoire antibodies in test set. A multi-sequence alignment of the 20 CST antibodies with the 20 repertoire antibodies in the test set is performed. The 400 pairwise sequence identities are shown for the (a) variable heavy, VH and the (b) variable light, VL.
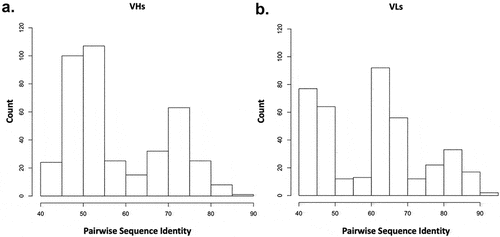
Figure 8. Test set performance with varying training-set size. The number of clinical antibody sequences used in the training set increased from 10 sequences to 339. Performance on a standardize hold-out test set plateaus after 80 clinical antibodies are used in the training set.
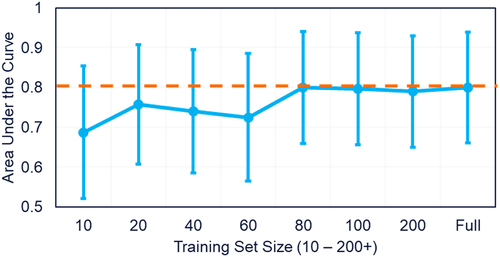
Table 1. TA-DA vs. biophysical assays. A rank-order correlation metric is calculated between TA-DA and a dozen biophysical assays measured by Jain et al.Citation9