Figures & data
Figure 1. Affinity ranking of scFvs and Kaplan–Meier survival curves for mice co-administered with IgG antibodies and α-cobratoxin. (a) direct and ENC DELFIA of 36 monoclonal scFv-containing supernatants. (b) direct and ENC DELFIA of the top six monoclonal scFv-containing supernatants. (c) Kaplan–Meier survival curves for mice co-administered with IgG antibodies and α-cobratoxin. α-cobratoxin refers to mice injected with α-cobratoxin alone.
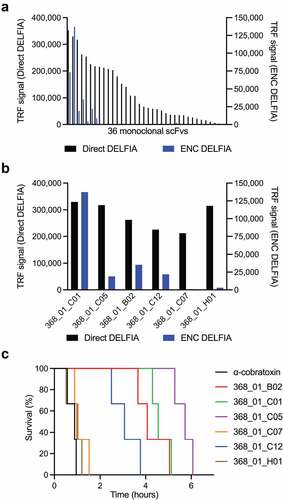
Figure 2. Binding, expression, and binding kinetics characterization of discovered antibodies. (a) direct monoclonal DELFIA signals (in black on the left Y-axis) and ENC DELFIA signals (in blue on the right Y-axis) of the 60 monoclonal scFvs selected for sequencing. (b) ENC DELFIA signals of IgG-containing supernatants of the 13 clones that were converted to the IgG format. 2552_02_B02 was selected for further characterization. for (A) and (B), data from the parent scFv (368_01_C01) is shown furthest to the right. (c) 1:1 binding model (black lines) fitted to the SPR data kinetics of parental antibody (368_01_C01) in the fab format. (d) 1:1 binding model (black lines) fitted to the SPR data of the affinity matured clone (2552_02_B02) in the fab format.
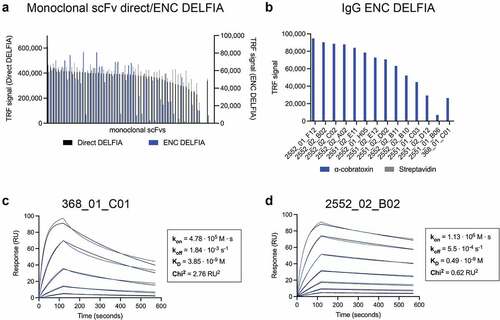
Figure 3. Inhibition of the binding interaction between the α7-AChR and α-cobratoxin using IgGs. (a) schematic representation of a receptor blocking assay, wherein the ability of IgG antibodies to inhibit the interaction between the α7 subunit of AChR (α7-AChR) and α-cobratoxin can be quantified. (b) antibodies block α-cobratoxin binding to its receptor (α7-AChR) in a concentration-dependent manner. as a negative control an IgG specific to dendrotoxins was used and showed no blocking (data not shown). Y-axis is signal relative to that of the positive control.
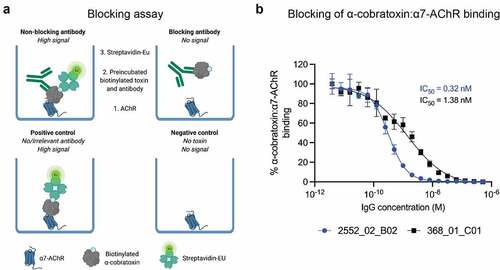
Figure 4. In vitro neutralization of inhibition of nAChR by α-cobratoxin. automated patch-clamp experiments conducted using a QPatch (Sophion Bioscience). (a) example of sweep plot and (b) concentration–response curve showing the relationship between increased ACh concentration and the measured current running across the cell membrane. 70 µM ACh was used throughout the rest of the experiments. (c) Example of sweep plot and (d) concentration–response curve showing how increasing concentrations of α-cobratoxin result in a decrease in the current measured. 4 nM α-cobratoxin was used, resulting in approximately 80% inhibition of the current. (e) example of sweep plot (368_01_C01) and (f) concentration–response curves showing how increasing concentrations of the two IgGs preincubated with α-cobratoxin result in better protection of the nAChR, as the loss of current mediated by α-cobratoxin is prevented in a dose-dependent manner. An irrelevant IgG was used as a control, which did not prevent the inhibitory effects of α-cobratoxin (data not shown).
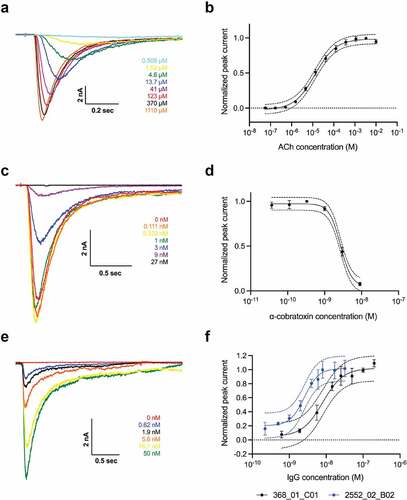
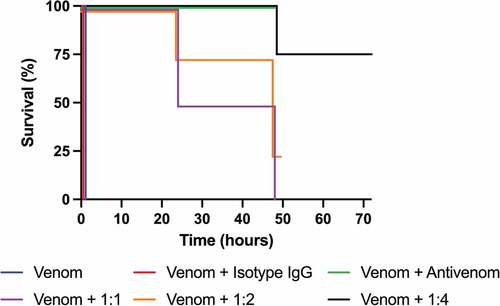
Figure 5. Kaplan–Meier curves showing survival of mice co-administered with N. kaouthia whole venom and IgG 2552_02_B02. 1:1, 1:2, and 1:4 designates the toxin:IgG molar ratio that 2552_02_B02 was injected in. The death of the venom only and antibody isotype control groups occurred within 30 minutes after injection, whereas those receiving venom and antivenom survived the 48-hour observation period. All groups were observed for 48 hours, except mice receiving 2552_02_B02 in a 1:4 molar ratio, which were observed for 72 hours.