Figures & data
Figure 1. An ESI mass spectrum of unprocessed monoclonal IgE sample acquired under near-native conditions (gray-filled curve). The charge ladders shown in color represent LCR MS measurements for precursor ions selected at m/z 3640 (maroon), 4200 (blue), 5200 (orange) and 6820 (white). See Supplementary Material for a more detailed view of the data presented in this figure.
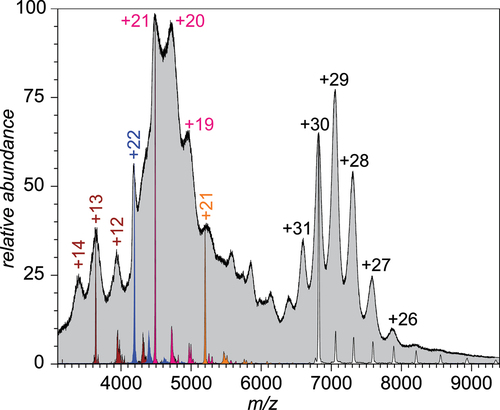
Figure 2. An ESI mass spectrum of SEC-purified monoclonal IgE sample acquired under near-native conditions (red-filled curve). The charge ladders shown in color represent LCR MS measurements for precursor ions selected at m/z 4650 (blue), 5200 (orange) and 6820 (white). The inset shows SEC chromatograms of the unprocessed and purified IgE samples (gray and red, respectively). See Supplementary Material for a more detailed view of the data presented in this figure.
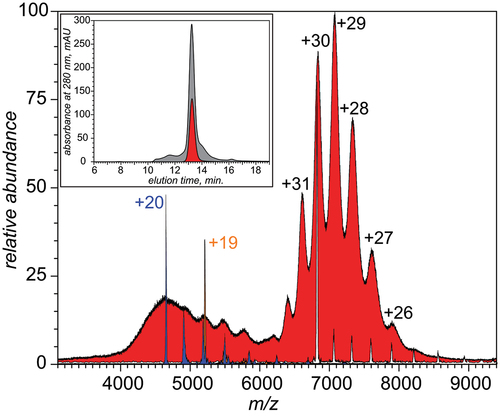
Figure 3. Native ESI mass spectra (a) and SEC chromatograms (b) of monoclonal anti-ovalbumin IgE incubated with ovalbumin at molar ratios 2:1 (red), 1:1 (gold), 2:3 (olive) and 1:2 (violet). The gray and black traces represent free antibody and antigen, respectively.
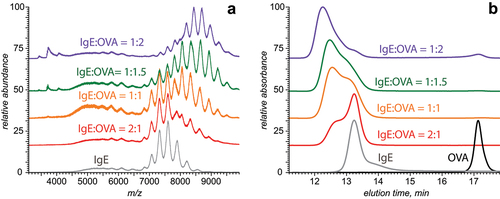
Figure 4. Charge state assignments of ionic signal in native ESI mass spectra of the IgE/OVA mixtures acquired at 2:3 (a) and 1:2 (b) molar ratios. Charge state assignments were carried out using LCR of ionic populations isolated within narrow m/z windows (see the text for more detail). The peak labels correspond to free IgE (italicized), IgE·OVA (regular font) and IgE·(OVA)2 (bold face). See Supplementary Material for a more detailed view of the data presented in this figure.
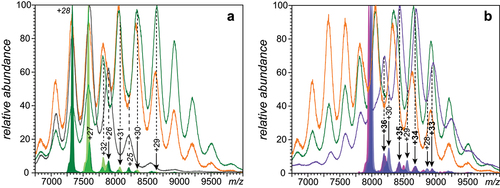
Figure 5. Fitting the native ESI mass spectra of the IgE/OVA mixtures acquired at 1:1 (a) and 2:3 (b) molar ratios with calculated ionic signals for the IgE·(OVA)2 (blue) and IgE·OVA (red) complexes, and the antigen-free antibody (gray).
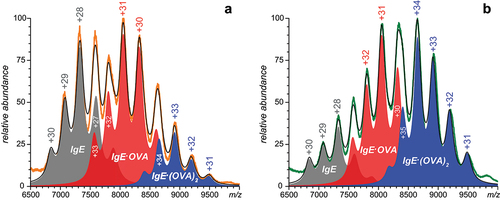
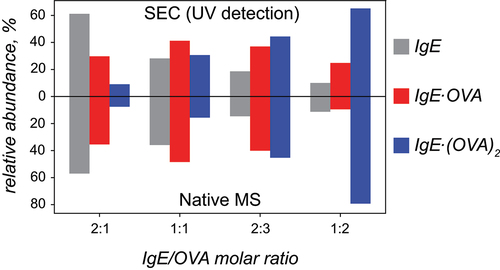
Figure 6. Relative abundance of IgE and its complexes with the antigen (OVA) in solutions with varying IgE/OVA ratios derived from SEC (top) and native ESI MS (bottom).