
Figures & data
Table 1. SPR and MST binding of mAbs to PLBL2 and LPLA2.
Figure 1. Native mass spectrum of 10:1 IgG4-B to (a) LPLA2 and (b) PLBL2.
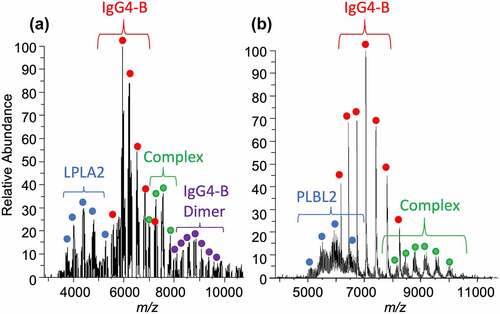
Figure 2. (a) 1:1 PPT1:IgG4-B stoichiometric complex formed in a solution at 100:1 relative molar concentration. (b) 2:1 stoichiometric PLD3: IgG4-B complex formed at 10:1 relative molar concentration in solution. PLD3 was found naturally in solution as a dimer. The mAb peak (not shown) at 6439 m/z (+23) is set to 100% relative abundance in each spectrum for scale. The antibody is 0.27 μM.
Figure 3. Ion mobility spectra of IgG1-A (purple), IgG1-B (red), and IgG4-B (orange) complexed to PLBL2 (blue) resulted in different quantities of 1:1 complex (gray) detected at ~51 1/K.
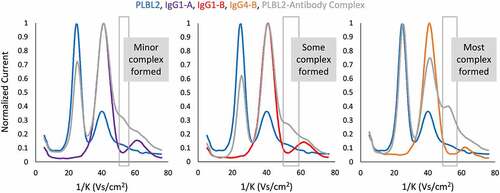
Figure 4. (a) The relative abundance of sialylated, mannosylated, and fucosylated N-glycan species detected from each lipase. For glycans containing both a fucose and sialic species, its abundance was counted as contributing to both the fucosylated and sialylated groups. (b) The relative proportion of high mannose species detected for each lipase.
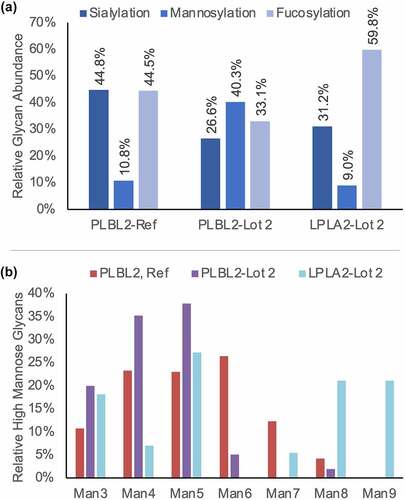
Figure 5. Change in oxidation levels of LPLA2 peptides free or complexed to (a) IgG4-B or (b) IgG1-B. (c) Binding region of IgG4-B and IgG1-B mapped to the structure of LPLA2. (d) LPLA2 sequence with binding region and glycosylation sites highlighted. Change in oxidation levels of PLBL2 peptides free or complexed to (e) IgG4-B or (f) IgG1-B (g) Binding region of IgG4-B and IgG1-B mapped to the structure of PLBL2 (red = common binding region, blue = IgG4-B binding region, green = IgG1-B binding region). (h) PLBL2 sequence with binding region and glycosylation sites highlighted.
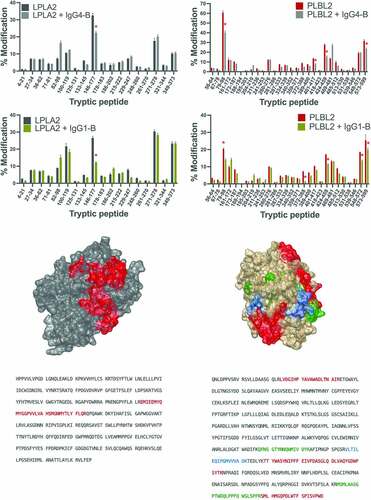
Figure 6. Change in oxidation levels of peptides in IgG4-B free or complexed to (a) LPLA2 or (b) PLBL2 or IgG1-B free or complexed to (c) LPLA2 or (d) PLBL2.
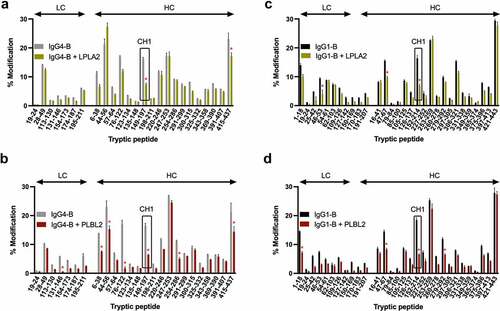
Figure 7. VC50 values extracted from native MS binding dissociation curves for (a) PLBL2 and (b) LPLA2 against IgG4-B. Confidence intervals (95%) are shown as error bars, with significant different to WT at 95% or 90% confidence shown as * or +, respectively.
Table 2. Ratio of the LPLA2- IgG4-B complex peak areas, normalized against the total IM spectral area, for each of the IgG4-B mutants.