Figures & data
Figure 1. Effect of IFNγ on the metabolism of mouse pancreatic organoids. a) Schematic representation of the timeline using mouse pancreatic organoids. b) Immunoblotting of PD-L1 and CTLA4 protein expression following a concentration range of IFNγ exposure at 24 hr and 48 hr. c) Metabolic profiling of mouse pancreatic organoids following IFNγ exposure (24 hr, 10 ng/mL). Arrows indicate respectively injection of oligomycin, FCCP, rotenone/antimycin. d) Extracellular acidification rate (ECAR), basal oxygen consumption rate (OCR), and ATP production were measured using a metabolic bioanalyzer following IFNγ exposure (24 hr, 10 ng/mL). *p < .05.
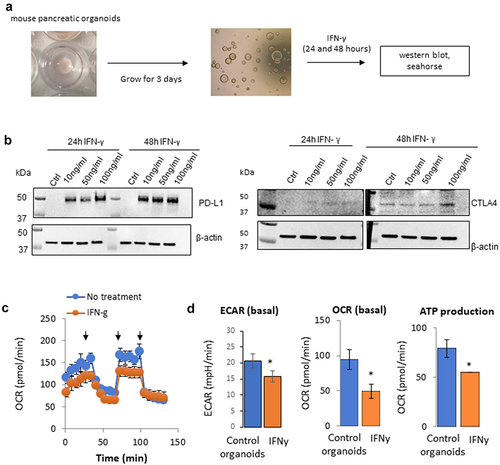
Figure 2. Metabolic effects of PD-L1 blocking antibodies on mouse pancreatic organoids. Oxygen consumption rates (OCR) and extracellular acidification rates (ECAR) were measured using a seahorse bioanalyzer following treatment of the organoids with avelumab or durvalumab (5, 10, or 20 μg/mL, 24 hr) with and without IFNγ (10 ng/mL). a) Effects of avelumab (AVE) without IFNγ. b) Effect of durvalumab (DUR) without IFNγ. c) Effects of avelumab (AVE) with IFNγ. d) Effect of durvalumab (DUR) with IFNγ. *p < .05; n.s.: not significant. Experiments were repeated three times with 4–5 technical replicates per plates.
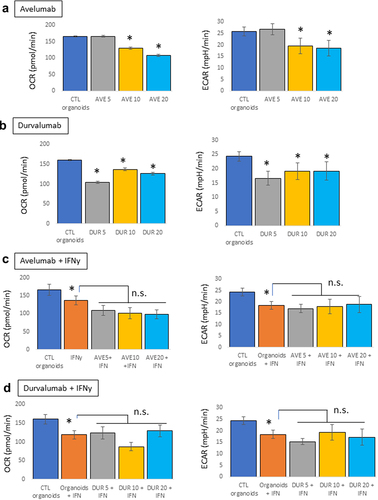
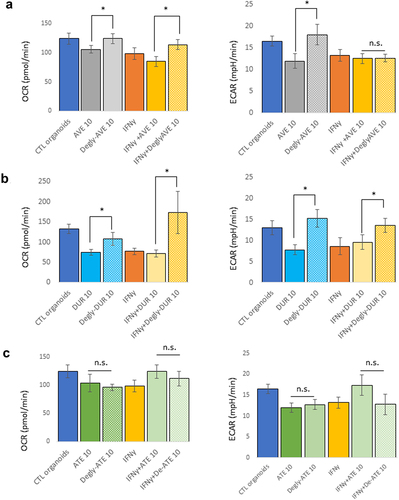
Figure 3. Effect of deglycosylation of mAbs on the metabolism of mouse pancreatic organoids. Avelumab (a) and Durvalumab (b) were deglycosylated, and cells were treated with glycosylated or deglycosylated mAbs (10 μg/mL, 24 hr) and with or without IFNγ (10 ng/mL). c) Atezolizumab is not glycosylated and was used as a control. “Degly-ATE” indicates that atezolizumab was subjected to the deglycosylation protocol as a control. *p < .05; n.s.: not significant. Experiments were repeated three times with 3–4 technical replicates per plates.